Exhibit 99.4
VALUATION & FINANCIAL ADVISORY | INVESTMENT BANKING | LITIGATION SUPPORT INVESTMENT BANKING PRIVATE & CONFIDENTIAL Presentation of Fairness to the Special Committee of the Board of Directors of CLS Holdings USA, Inc. April 8, 2025 VALUATION & FINANCIAL ADVISORY LITIGATION SUPPORT
P REFACE This material has been prepared by Houlihan Capital, LLC (“Houlihan Capital”) as part of a presentation being made to the Special Committee of the Board of Directors (the “Special Committee”) of CLS Holdings USA, Inc . (collectively, the “Client”, the “Company”, or “CLS Holdings”) in support of ou r opinion (the “Opinion”) whether or not favorable, to the Special Committee of the Company as to whether, as of the date of such Opinion, the transaction to engage in a business combination with the purpose of taking the Company private in a reverse merger (the “Transaction”) is fair to the shareholders of the Company from a financial point of view . Our analyses contained herein are confidential and addressed to, and provided exclusively for use by, the Special Committee . Our written opinion may be used (i) by the Special Committee in evaluating the Transaction, (ii) in disclosure materials to holders of Client’s equity holders, (iii) in filings with the U . S . Securities and Exchange Commission (the “SEC”) (including the filing of the fairness opinion and the data and analysis presented by Houlihan Capital to the Board), and (iv) in any litigation pertaining to matters relating to the Transaction and covered in the Opinion . This Opinion is delivered to each recipient subject to the conditions, scope of engagement, limitations and understandings set forth in the Opinion and subject to the understanding that the obligations of Houlihan Capital and any of its affiliates in the Transaction are solely corporate obligations, and no officer, director, principal, employee, affiliate, or member of Houlihan Capital or their successors or assigns shall be subjected to any personal liability whatsoever (other than for intentional misconduct, fraud, or gross negligence), nor will any such claim be asserted by or on behalf of you or your affiliates against any such person with respect to the Opinion other than Houlihan Capital . We have relied upon and assumed, without independent verification, the accuracy, completeness and reasonableness of the financial, legal, tax, and other information discussed with or reviewed by us and have assumed such accuracy and completeness for purposes of rendering an opinion . In addition, we have not made any independent evaluation or appraisal of any of the assets or liabilities (contingent or otherwise) of the Company, nor, except as stated herein, have we been furnished with any such evaluation or appraisal . We have further relied upon the assurances and representations from company management that they are unaware of any facts that would make the information CONFIDENTIAL Page | 2
P REFACE provided to us to be incomplete or misleading in any material respect for the purposes of the Opinion . We have not assumed responsibility for any independent verification of this information, nor have we assumed any obligation to verify this information . Nothing has come to our attention in the course of this engagement which would lead us to believe that (i) any information provided to us or assumptions made by us are insufficient or inaccurate in any material respect or (ii) it is unreasonable for us to use and rely upon such information or make such assumptions . The conclusions we have reached are based on all the analyses and factors presented herein taken as a whole and also on the application of ou r own experience and judgment . Such conclusions may involve significant elements of subjective judgment or qualitative analysis . We therefore give no opinion as to the value or merit standing alone of any one or more parts of the material that follows . Our only opinion is the formal written opinion Houlihan Capital has expressed as to whether, as of the date of such Opinion, that the consideration to be issued or paid in the Transaction is fair from a financial point of view to the Company and the shareholders of the Company . The Opinion does not constitute a recommendation to proceed with the Transaction . Houlihan Capital was not requested to opine as to, and the Opinion does not address, the (i) underlying business decision of Company, its shareholders, or any other party to proceed with or effect the proposed Transaction, (ii) financial fairness of any aspect of the proposed Transaction not expressly addressed in the Opinion, (iii) terms of the Transaction (except with respect to financial fairness), including, without limitation, the closing conditions and any of the other provisions thereof, (iv) fairness of any portion or aspect of the proposed Transaction to the holders of any securities, creditors, or other constituencies of the Company, or any other party, other than those set forth in the Opinion, (v) relative corporate or other merits of the proposed Transaction as compared to any alternative business strategies that might exist for the Company, or (vi) tax, accounting, or legal consequences of the proposed Transaction to either the Company, its shareholders, or any other party . In our analysis and in connection with the preparation of the Opinion, Houlihan Capital has made numerous assumptions with respect to industry performance, general business, market and economic conditions and other matters, many of which are beyond the control of any party involved in the Transaction . The Opinion, the analyses CONFIDENTIAL Page | 3

P REFACE contained herein, and all conclusions drawn from such analyses are necessarily based upon market, economic and other conditions that exist and can be evaluated as of the date of this presentation . Houlihan Capital, a Financial Industry Regulatory Authority (FINRA) member, as part of its investment banking services, is regularly engaged in the valuation of businesses and securities in connection with mergers and acquisitions, private placements, bankruptcy, capital restructuring, solvency analyses, stock buybacks, and valuations for corporate and other purposes . Neither Houlihan Capital, nor any of its principals, has any ownership or other beneficial interests in the Company and has provided no previous investment banking or consulting services to the Company . Houlihan Capital has received and is receiving a fee from the Company relating to its services in providing this Opinion that is not contingent on the consummation of the proposed Transaction . In an engagement letter dated January 30 , 2025 , Client has agreed to indemnify Houlihan Capital for certain specified matters in connection with Houlihan Capital’s services . CONFIDENTIAL Page | 4
E XECUTIVE S UMMARY E xecutive Summary ............................................................................................................................. ... ...................... 6 Transaction Overview..................................................................................................................... ... ....................................................6 Fairness Opinion Conclusion ............................................................................................................................. ... ...............................7 Houlihan Capital Engagement................................................................................................................... ... ........................................8 Due Diligence Procedures................................................................................................................... ... .............................................11 Overview of the Company...................................................................................................................... ... ...................12 Fairness Opinion Overview ............................................................................................................................. ... .........17 Valuation Methodologies................................................................................................................ ... ..........................18 Fair Market Value Analysis..................................................................................................................... ... ..................20 Market Approach..................................................................................................................... ... ..........................................................20 Control Premium...................................................................................................................... ... .........................................................28 Valuation Conclusion................................................................................................................... ... .....................................................32 Fairness Opinion Conclusion ............................................................................................................................. ... ......33 Guideline Public Company Descriptions................................................................................................................. ... ......................34 Guideline Public Company Tables....................................................................................................................... ... ...........................38 Guideline Transaction Target Company Descriptions................................................................................................................. ... 40 CONFIDENTIAL Page | 5

E XECUTIVE S UMMARY T RANSACTION O VERVIEW Houlihan Capital, LLC (“Houlihan Capital”) understands that CLS Holdings USA, Inc . and/or its affiliates (the “Client” or the “Company” or “CLS Holdings”) intends to enter into a business combination with the purpose of taking the Company private in a reverse merger . Per conversations with the Client, we understand the Transaction will be structured as a 4 million to 1 reverse stock split, wherein every 4 million shares will be converted to one share post - Transaction . Houlihan Capital understands the Special Committee anticipates the Company would pay “fair value” for the shares, which under Nevada state law is determined as : ( 1 ) immediately before the effectuation of the corporate action to which the dissenter objects, excluding any appreciation or depreciation in anticipation of the corporate action (unless exclusion would be inequitable) ; ( 2 ) using customary and current valuation concepts and techniques generally employed for similar businesses in the context of the transaction requiring appraisal ; and ( 3 ) without discounting for lack of marketability or minority status 1 . Houlihan Capital further notes Nevada state law defines “market value” in reference to shares of a corporation as the highest closing sale price of a share during the 30 calendar days immediately preceding the date in question on the applicable securities exchange 2 . Any stockholder with a fractional share count post - Transaction will be paid out in cash at a later date . Houlihan Capital understands the transaction price determined by the Special Committee to be $ 0 . 037 per share (“Transaction Price”) . 1 As defined in the Nevada Revised Statutes 92A.310, “Fair Value” defined. 2 As defined in the Nevada Revised Statutes 78.424, “Market Value” defined. CONFIDENTIAL Page | 6

E XECUTIVE S UMMARY $0.015 $0.020 $0.025 $0.030 $0.035 $0.040 Fairness Opinion Conclusion Pursuant to an engagement letter dated January 30 , 2025 , the Special Committee of the Company (the “Special Committee”) engaged Houlihan Capital as its financial advisor to render a written opinion (the “Opinion”), whether or not favorable, to the Special Committee as to whether, as of the date of such Opinion, the Transaction is fair from a financial point of view to the Company and the minority, unaffiliated stockholders of the Company . As of the date hereof, it is Houlihan Capital’s opinion that the per share value to be paid in the Transaction is fair from a financial point of view to the Company and the shareholders of the Company . Indicated Fair Value of Equity Per Share Current Stock Price 30 - Day Max GPC: EV/Revenue - LTM GPC: EV/Revenue - 2025 GPC: EV/Revenue - 2026 CTM: EV/Revenue - LTM CONFIDENTIAL Page | 7
E XECUTIVE S UMMARY H OULIHAN C APITAL E NGAGEMENT Houlihan Capital was given unlimited access to pertinent information from the Company while conducting due diligence in order to identify key issues and parties involved and identify methods of analyses to be considered in the Opinion. Houlihan Capital analyzed the Transaction and the per share value to be received and realized by the Company. As addressed further herein, Houlihan Capital analyzed internal and external factors which could influence the value of the Target and performed such other analyses deemed appropriate and consistent with accepted business valuation techniques . Houlihan Capital prepared its Opinion and conducted an internal fairness committee meeting in order to assess whether, as of the date of such Opinion, that the consideration to be issued or paid in the Transaction is fair from a financial point of view to the Company and the shareholders of the Company . The conclusions set forth in the Opinion, and its delivery to the Special Committee on the date hereof, have been approved by Houlihan Capital’s internal fairness committee. Our only opinion is the formal written opinion Houlihan Capital has expressed as to whether, as of the date of such Opinion, that the consideration to be issued or paid in the Transaction is fair from a financial point of view to the Company and the shareholders of the Company . The Opinion does not constitute a recommendation to proceed with the Transaction . Houlihan Capital was not requested to opine as to, and the Opinion does not address, the : o Underlying business decision of Company, its shareholders, or any other party to proceed with or effect the proposed Transaction; o Financial fairness of any aspect of the proposed Transaction not expressly addressed in the Opinion; CONFIDENTIAL Page | 8
E XECUTIVE S UMMARY o Terms of the Transaction (except with respect to financial fairness), including, without limitation, the closing conditions and any of the other provisions thereof; o Fairness of any portion or aspect of the proposed Transaction to the holders of any securities, creditors, or other constituencies of the Company, or any other party, other than those set forth in the Opinion; o Relative corporate or other merits of the proposed Transaction as compared to any alternative business strategies that might exist for the Company; or o Tax, accounting, or legal consequences of the proposed Transaction to either the Company, its shareholders, or any other party. No opinion, counsel, or interpretation was intended or should be inferred with respect to matters that require legal, regulatory, accounting, insurance, tax, or other similar professional advice . Furthermore, the Opinion does not address any aspect of the Special Committee’s recommendation to its shareholders with respect to the adoption of the Transaction or how any shareholder of the Company should vote with respect to such adoption or the statutory or other method by which the Company is seeking such vote in accordance with the terms of the Transaction, applicable law, and the Company’s organizational instruments . Houlihan Capital was not requested to make, and did not make, any physical inspection or independent appraisal or evaluation of any of the assets, properties, or liabilities (contingent or otherwise) of the Company . Houlihan Capital’s Opinion is necessarily based on financial, economic, market and other conditions as in effect on, and the information made available to it as of, the date of the Opinion . Houlihan Capital is under no obligation, to update, revise, reaffirm or withdraw the Opinion, or otherwise comment on or consider events occurring after the date of the Opinion . CONFIDENTIAL Page | 9
E XECUTIVE S UMMARY Houlihan Capital, a Financial Industry Regulatory Authority (FINRA) member, as part of its investment banking services, is regularly engaged in the valuation of businesses and securities in connection with mergers and acquisitions, private placements, bankruptcy, capital restructuring, solvency analyses, stock buybacks, and valuations for corporate and other purposes . Neither Houlihan Capital, nor any of its principals, has any ownership or other beneficial interests in the Company and has provided no previous investment banking or consulting services to the Company . Houlihan Capital was not requested to, and did not: o Initiate any discussions with, or solicit any indications of interest from, third parties with respect to the Transaction or any alternatives to the proposed Transaction; o Advise the Special Committee with respect to alternatives to the proposed Transaction. Houlihan Capital has received and is receiving a fee from the Company relating to its services in providing this Opinion that is not contingent on the consummation of the proposed Transaction . In an engagement letter dated January 30, 2025, the Company has agreed to indemnify Houlihan Capital for certain specified matters in connection with Houlihan Capital’s services relating to the Opinion. CONFIDENTIAL Page | 10
E XECUTIVE S UMMARY D UE D ILIGENCE P ROCEDURES In completing our analyses and for purposes of the Opinion set forth herein, Houlihan Capital has, among other things, performed the following : Held discussions with certain members of CLS Holdings’ senior management (“Management”) regarding the Transaction, the historical performance of the Company (giving effect to the Transaction), and the future outlook for the Company ; Review of information provided by Client including, but not limited to : o The Company’s latest reports on Form 10 - Q and 10 - K and other relevant public documents as filed with the Securities and Exchange Commission; o the unaudited financial statements for the year - to - date (“YTD”) period ended February 28, 2025 (Houlihan Capital notes the Company’s fiscal year ends May 31); o Management - provided financial projections for the fiscal year(s) ended (“FYE”) May 31, 2025, through May 31, 2027; o Operating Agreements related to CLS Holdings, Alternative Solutions LLC, and Serenity Wellness Growers LLC; o The Corporate Bylaws of CLS Holdings; o Various documents related to sixteen promissory notes issued at various times from January 2, 2024, through February 26, 2025; Reviewed the industry in which the Company operates, which included a review of (i) certain industry and economic research, (ii) certain comparable publicly traded companies and (iii) certain mergers and acquisitions of comparable businesses ; and Developed indications of value for the Company using generally accepted valuation methodologies . CONFIDENTIAL Page | 11
C OMPANY O VERVIEW – CLS H OLDINGS Overview of the Company 3 CLS Holdings (OTCPK : CLSH), was founded in 2014 and is based in Las Vegas, Nevada with two operating subsidiaries – City Trees and Oasis Cannabis Dispensary . As a vertically integrated cannabis company, CLS Holdings focuses on the extraction and conversion of cannabinoids in the United States . It extracts cannabinoids from cannabis plants and converts into them into various concentrates, including oils, waxes, edibles, and shatters ; and provides toll processing services (the provision of extraction services on a fee - for - service basis) . The company also sells organic medical cannabis to licensed retailers ; recreational marijuana cannabis products to licensed distributors and retailers ; extraction products, such as oils and waxes derived from in - house cannabis production ; and offers processing and extraction services for licensed medical cannabis cultivators, as well as cannabis strains in the f o rm of vegetative cuttings to licensed medical cannabis cultivators . The Company holds the U . S . patent on a proprietary extraction and conversion methodology to deliver high levels of quality and consistency . The Company’s warehouse includes 10 , 000 square feet of dedicated cultivation space . Nevada is currently not accepting applications for new retail store licenses . Per the Company’s latest 10 - Q (as of November 30 , 2024 ), the Company has approximately 164 , 734 , 517 shares of common stock outstanding, as presented below : 3 Sourced from the Company’s most recent 10 - Q and 10 - K. CONFIDENTIAL Page | 12
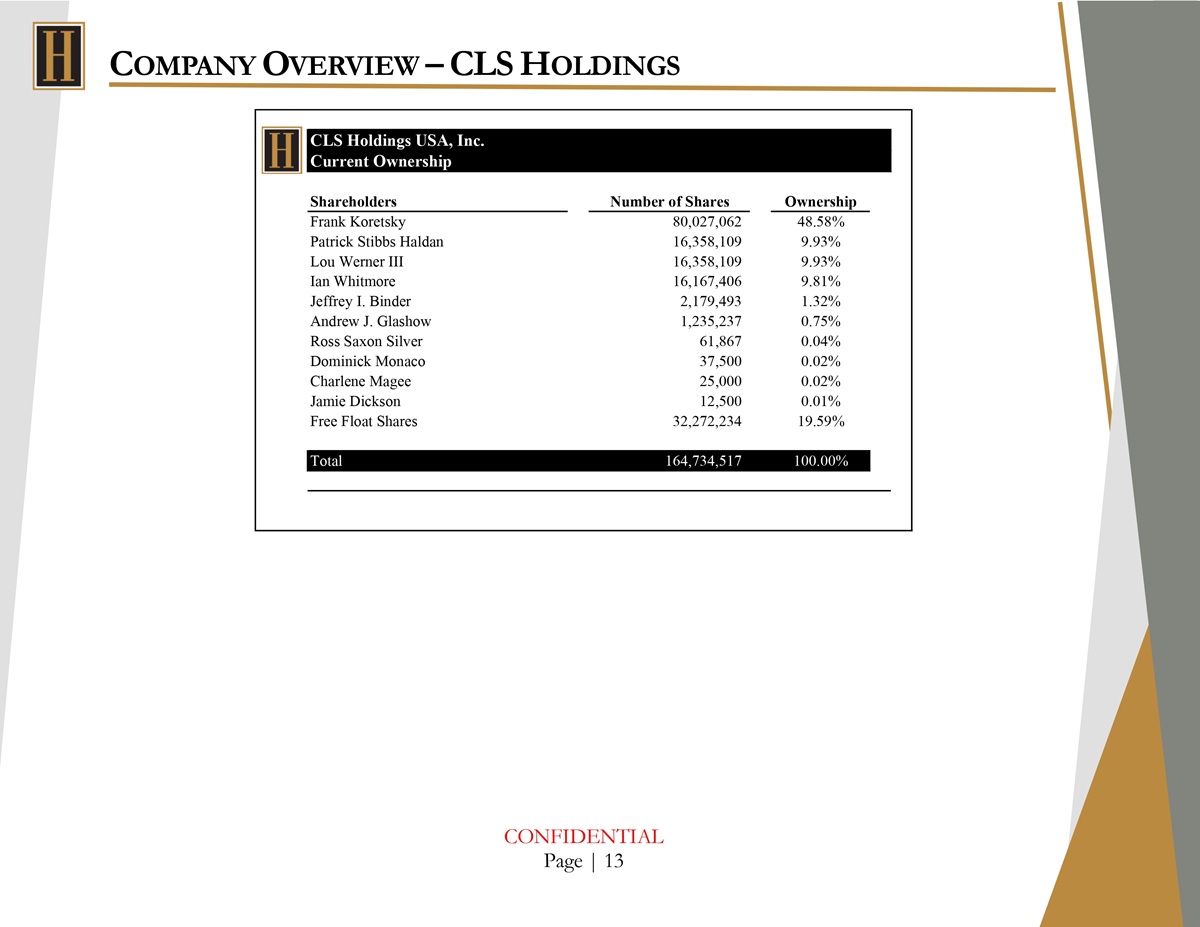
C OMPANY O VERVIEW – CLS H OLDINGS CLS Holdings USA, Inc. Current Ownership Shareholders Number of Shares Ownership Frank Koretsky Patrick Stibbs Haldan Lou Werner III Ian Whitmore Jeffrey I. Binder Andrew J. Glashow Ross Saxon Silver Dominick Monaco Charlene Magee Jamie Dickson Free Float Shares 80,027,062 16,358,109 16,358,109 16,167,406 2,179,493 1,235,237 61,867 37,500 25,000 12,500 32,272,234 48.58% 9.93% 9.93% 9.81% 1.32% 0.75% 0.04% 0.02% 0.02% 0.01% 19.59% Total 164,734,517 100.00% CONFIDENTIAL Page | 13
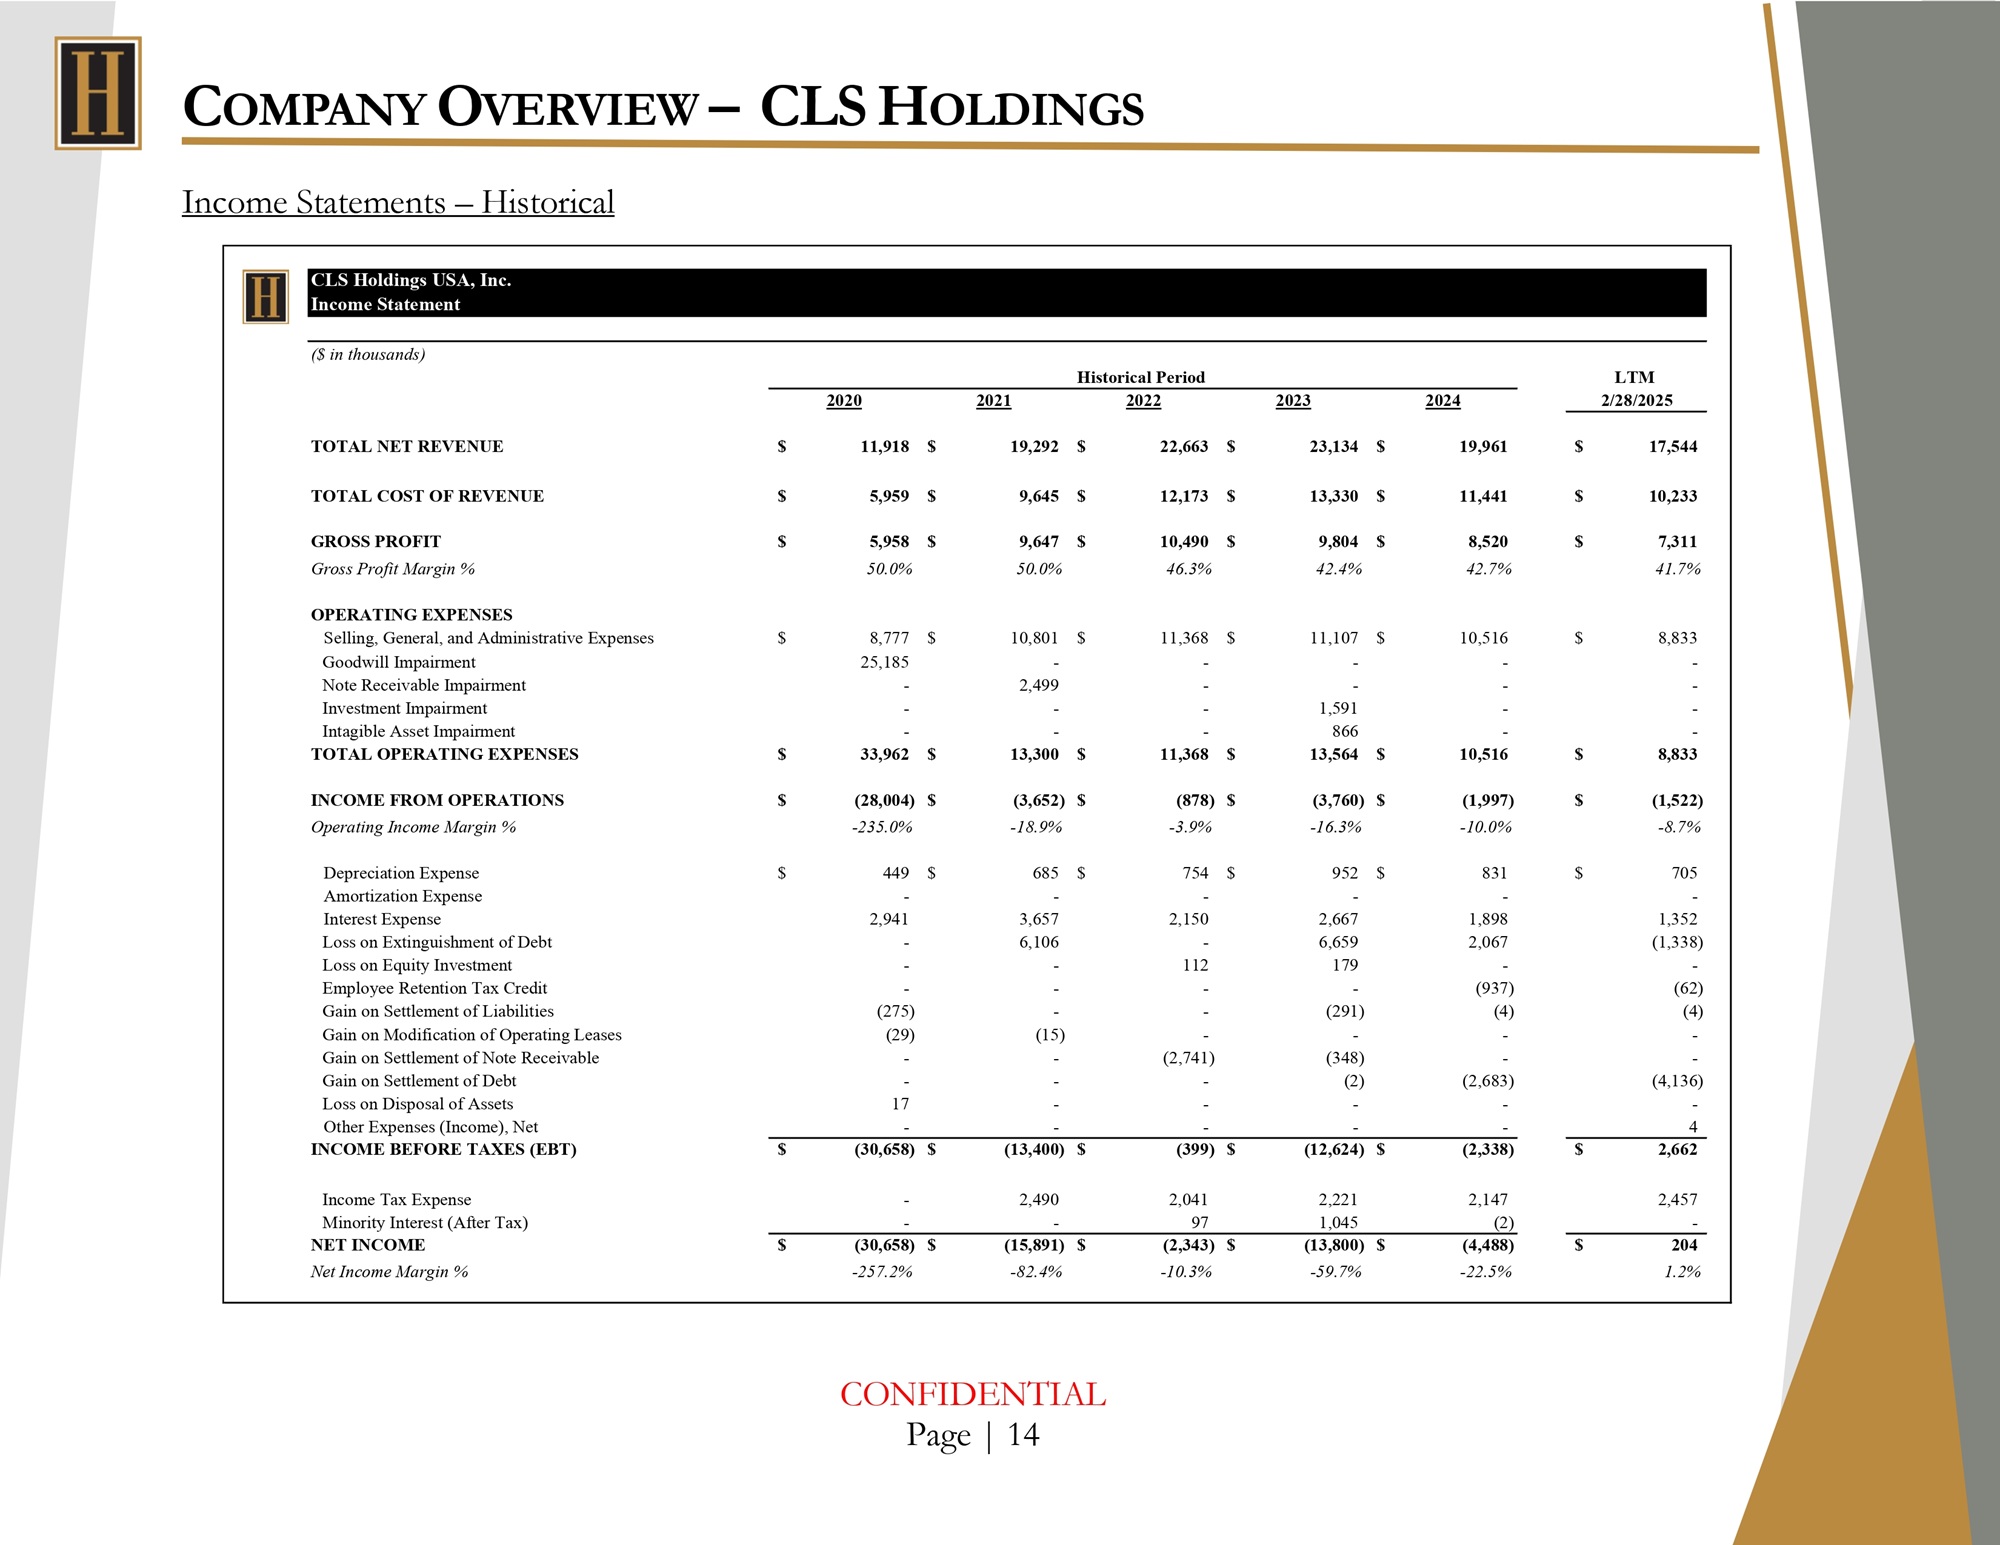
C OMPANY O VERVIEW – CLS H OLDINGS Income Statements – Historical CLS Holdings USA, Inc. Income Statement ($ in thousands) LTM Historical Period 2/28/2025 2024 2023 2022 2021 2020 $ 17,544 $ 19,961 $ 23,134 $ 22,663 $ 19,292 $ 11,918 TOTAL NET REVENUE $ 10,233 $ 11,441 $ 13,330 $ 12,173 $ 9,645 $ 5,959 TOTAL COST OF REVENUE $ 7,311 $ 8,520 $ 9,804 $ 10,490 $ 9,647 $ 5,958 GROSS PROFIT 41.7% 42.7% 42.4% 46.3% 50.0% 50.0% Gross Profit Margin % OPERATING EXPENSES $ 8,833 $ 10,516 $ 11,107 $ 11,368 $ 10,801 $ 8,777 Selling, General, and Administrative Expenses - - - - - 25,185 Goodwill Impairment - - - - 2,499 - Note Receivable Impairment - - 1,591 - - - Investment Impairment - - 866 - - - Intagible Asset Impairment $ 8,833 $ 10,516 $ 13,564 $ 11,368 $ 13,300 $ 33,962 TOTAL OPERATING EXPENSES $ (1,522) (1,997) (3,760) $ (878) $ (3,652) $ $ (28,004) $ INCOME FROM OPERATIONS - 8.7% - 10.0% - 16.3% - 3.9% - 18.9% - 235.0% Operating Income Margin % $ 705 $ 831 $ 952 $ 754 $ 685 $ 449 Depreciation Expense - - - - - - Amortization Expense 1,352 1,898 2,667 2,150 3,657 2,941 Interest Expense (1,338) 2,067 6,659 - 6,106 - Loss on Extinguishment of Debt - - 179 112 - - Loss on Equity Investment (62) (937) - - - - Employee Retention Tax Credit (4) (4) (291) - - (275) Gain on Settlement of Liabilities - - - - (15) (29) Gain on Modification of Operating Leases - - (348) (2,741) - - Gain on Settlement of Note Receivable (4,136) (2,683) (2) - - - Gain on Settlement of Debt - - - - - 17 Loss on Disposal of Assets 4 - - - - - Other Expenses (Income), Net 2,662 $ (2,338) (12,624) $ (399) $ (13,400) $ (30,658) $ $ INCOME BEFORE TAXES (EBT) 2,457 2,147 2,221 2,041 2,490 - Income Tax Expense - (2) 1,045 97 - - Minority Interest (After Tax) $ 204 (4,488) (13,800) $ (2,343) $ (15,891) $ $ (30,658) $ NET INCOME 1.2% - 22.5% - 59.7% - 10.3% - 82.4% - 257.2% Net Income Margin % CONFIDENTIAL Page | 14
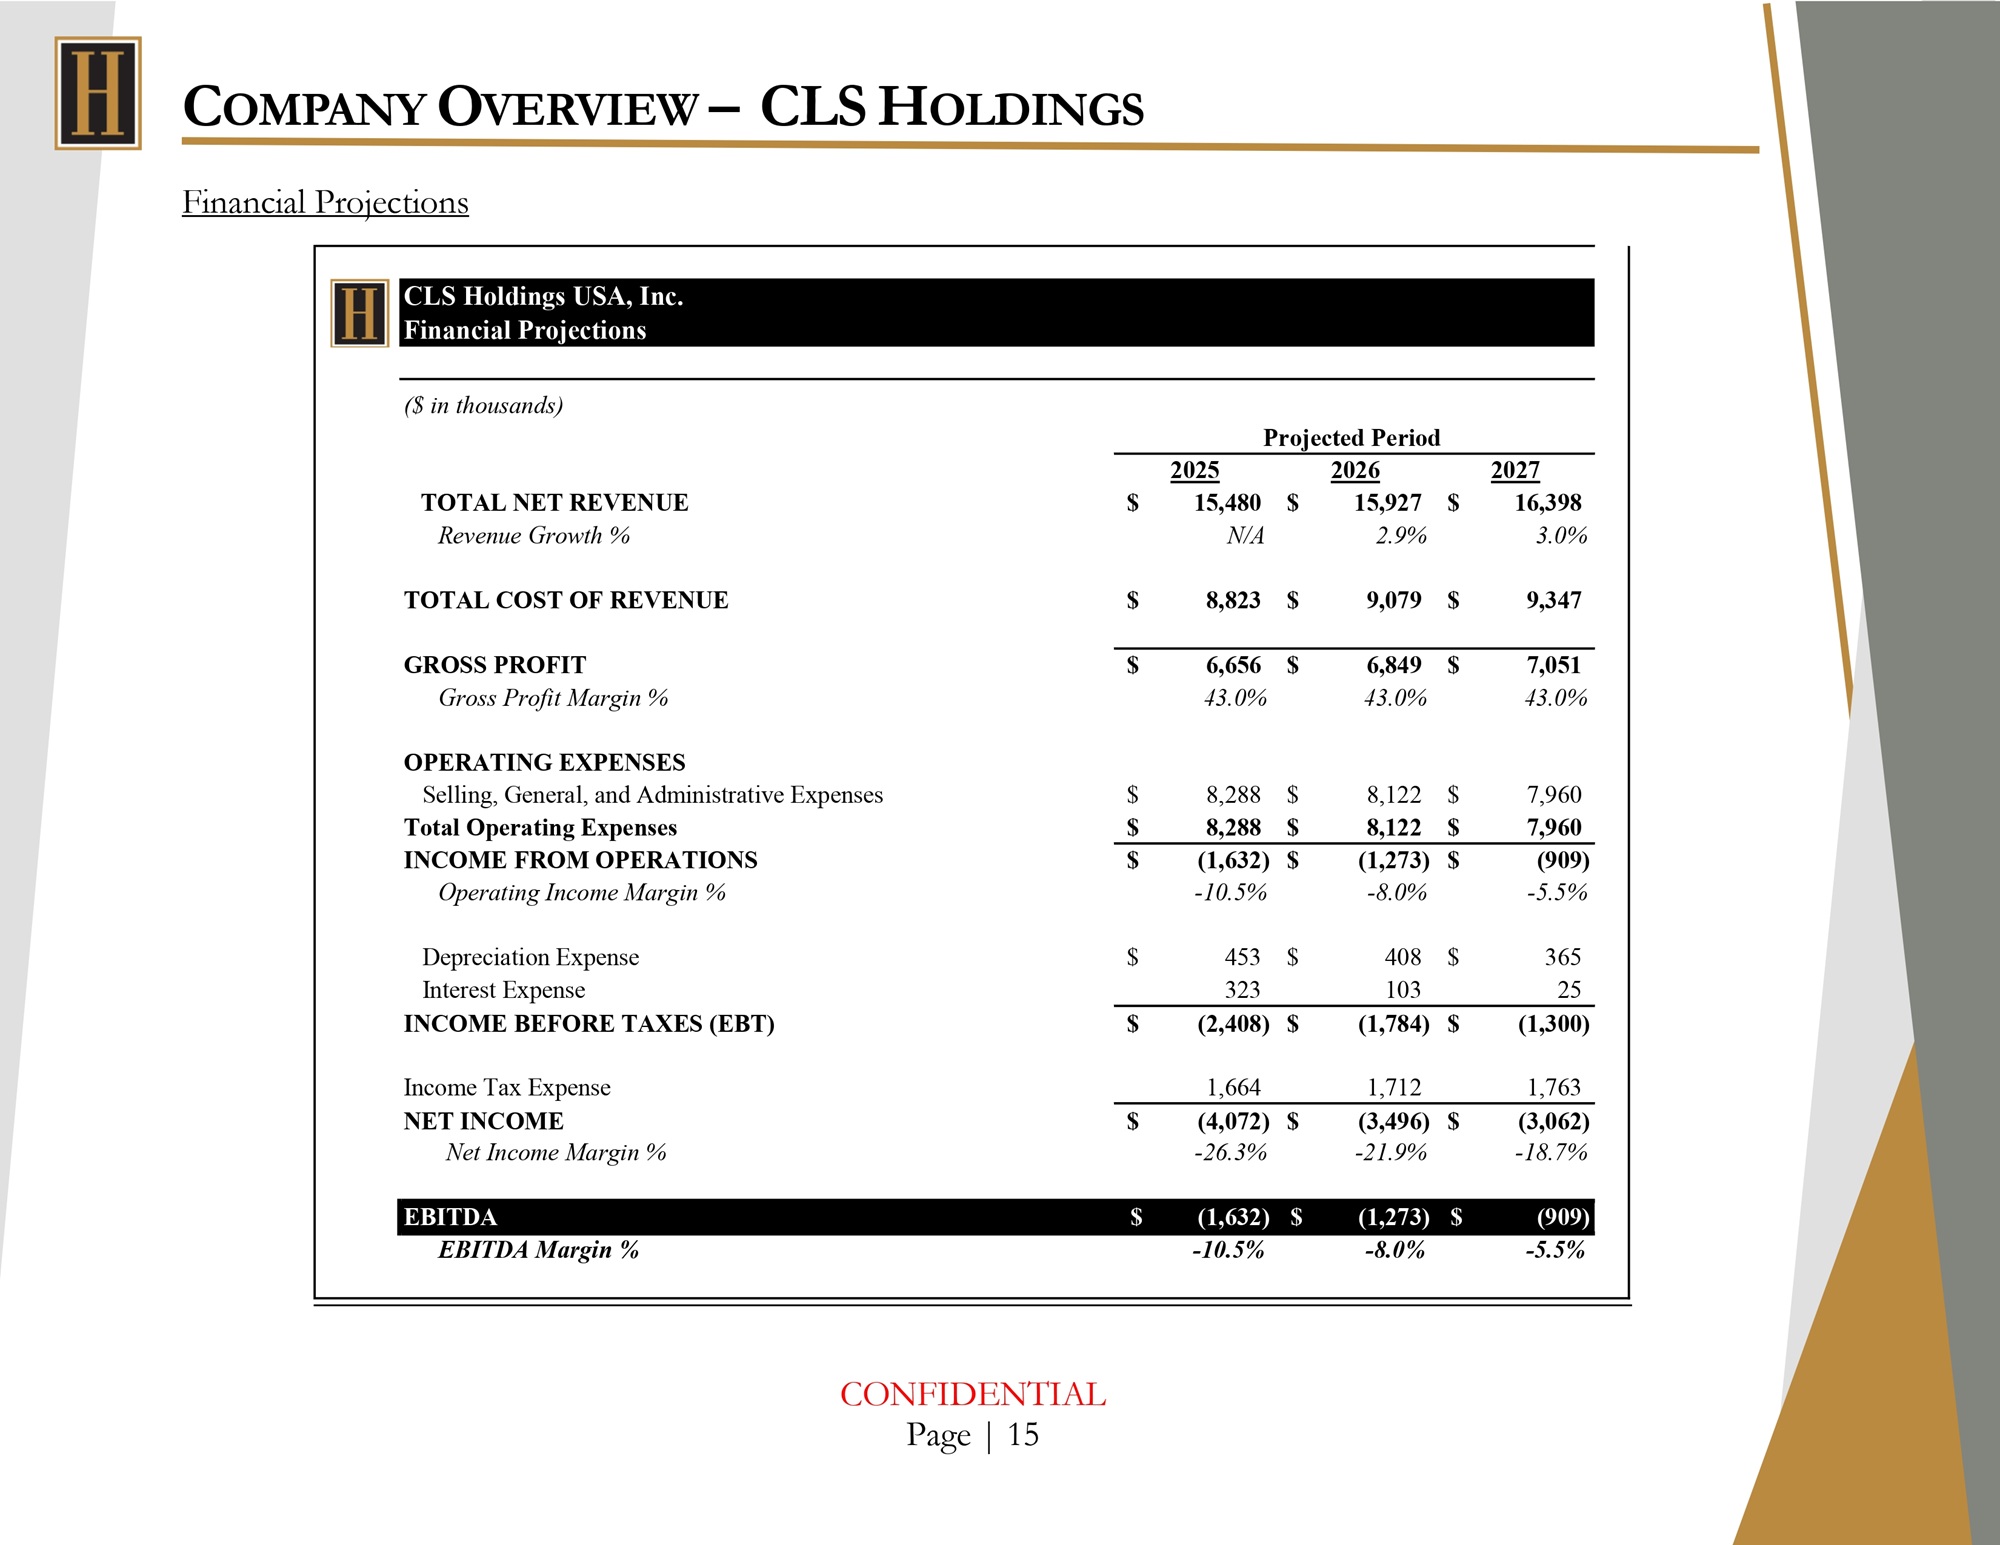
C OMPANY O VERVIEW – CLS H OLDINGS Financial Projections CLS Holdings USA, Inc. Financial Projections Projected Period ($ in thousands) 2027 $ 16,398 2026 $ 15,927 2025 $ 15,480 TOTAL NET REVENUE 3.0% 2.9% N/A Revenue Growth % $ 9,347 $ 9,079 $ 8,823 TOTAL COST OF REVENUE $ 7,051 $ 6,849 $ 6,656 GROSS PROFIT 43.0% 43.0% 43.0% Gross Profit Margin % OPERATING EXPENSES $ 7,960 $ 8,122 $ 8,288 Selling, General, and Administrative Expenses $ 7,960 $ 8,122 $ 8,288 Total Operating Expenses $ (909) $ (1,273) $ (1,632) INCOME FROM OPERATIONS - 5.5% - 8.0% - 10.5% Operating Income Margin % $ 365 $ 408 $ 453 Depreciation Expense 25 103 323 Interest Expense $ (1,300) $ (1,784) $ (2,408) INCOME BEFORE TAXES (EBT) 1,763 1,712 1,664 Income Tax Expense $ (3,062) $ (3,496) $ (4,072) NET INCOME - 18.7% - 21.9% - 26.3% Net Income Margin % $ (909) $ (1,273) $ (1,632) EBITDA - 5.5% - 8.0% - 10.5% EBITDA Margin % CONFIDENTIAL Page | 15
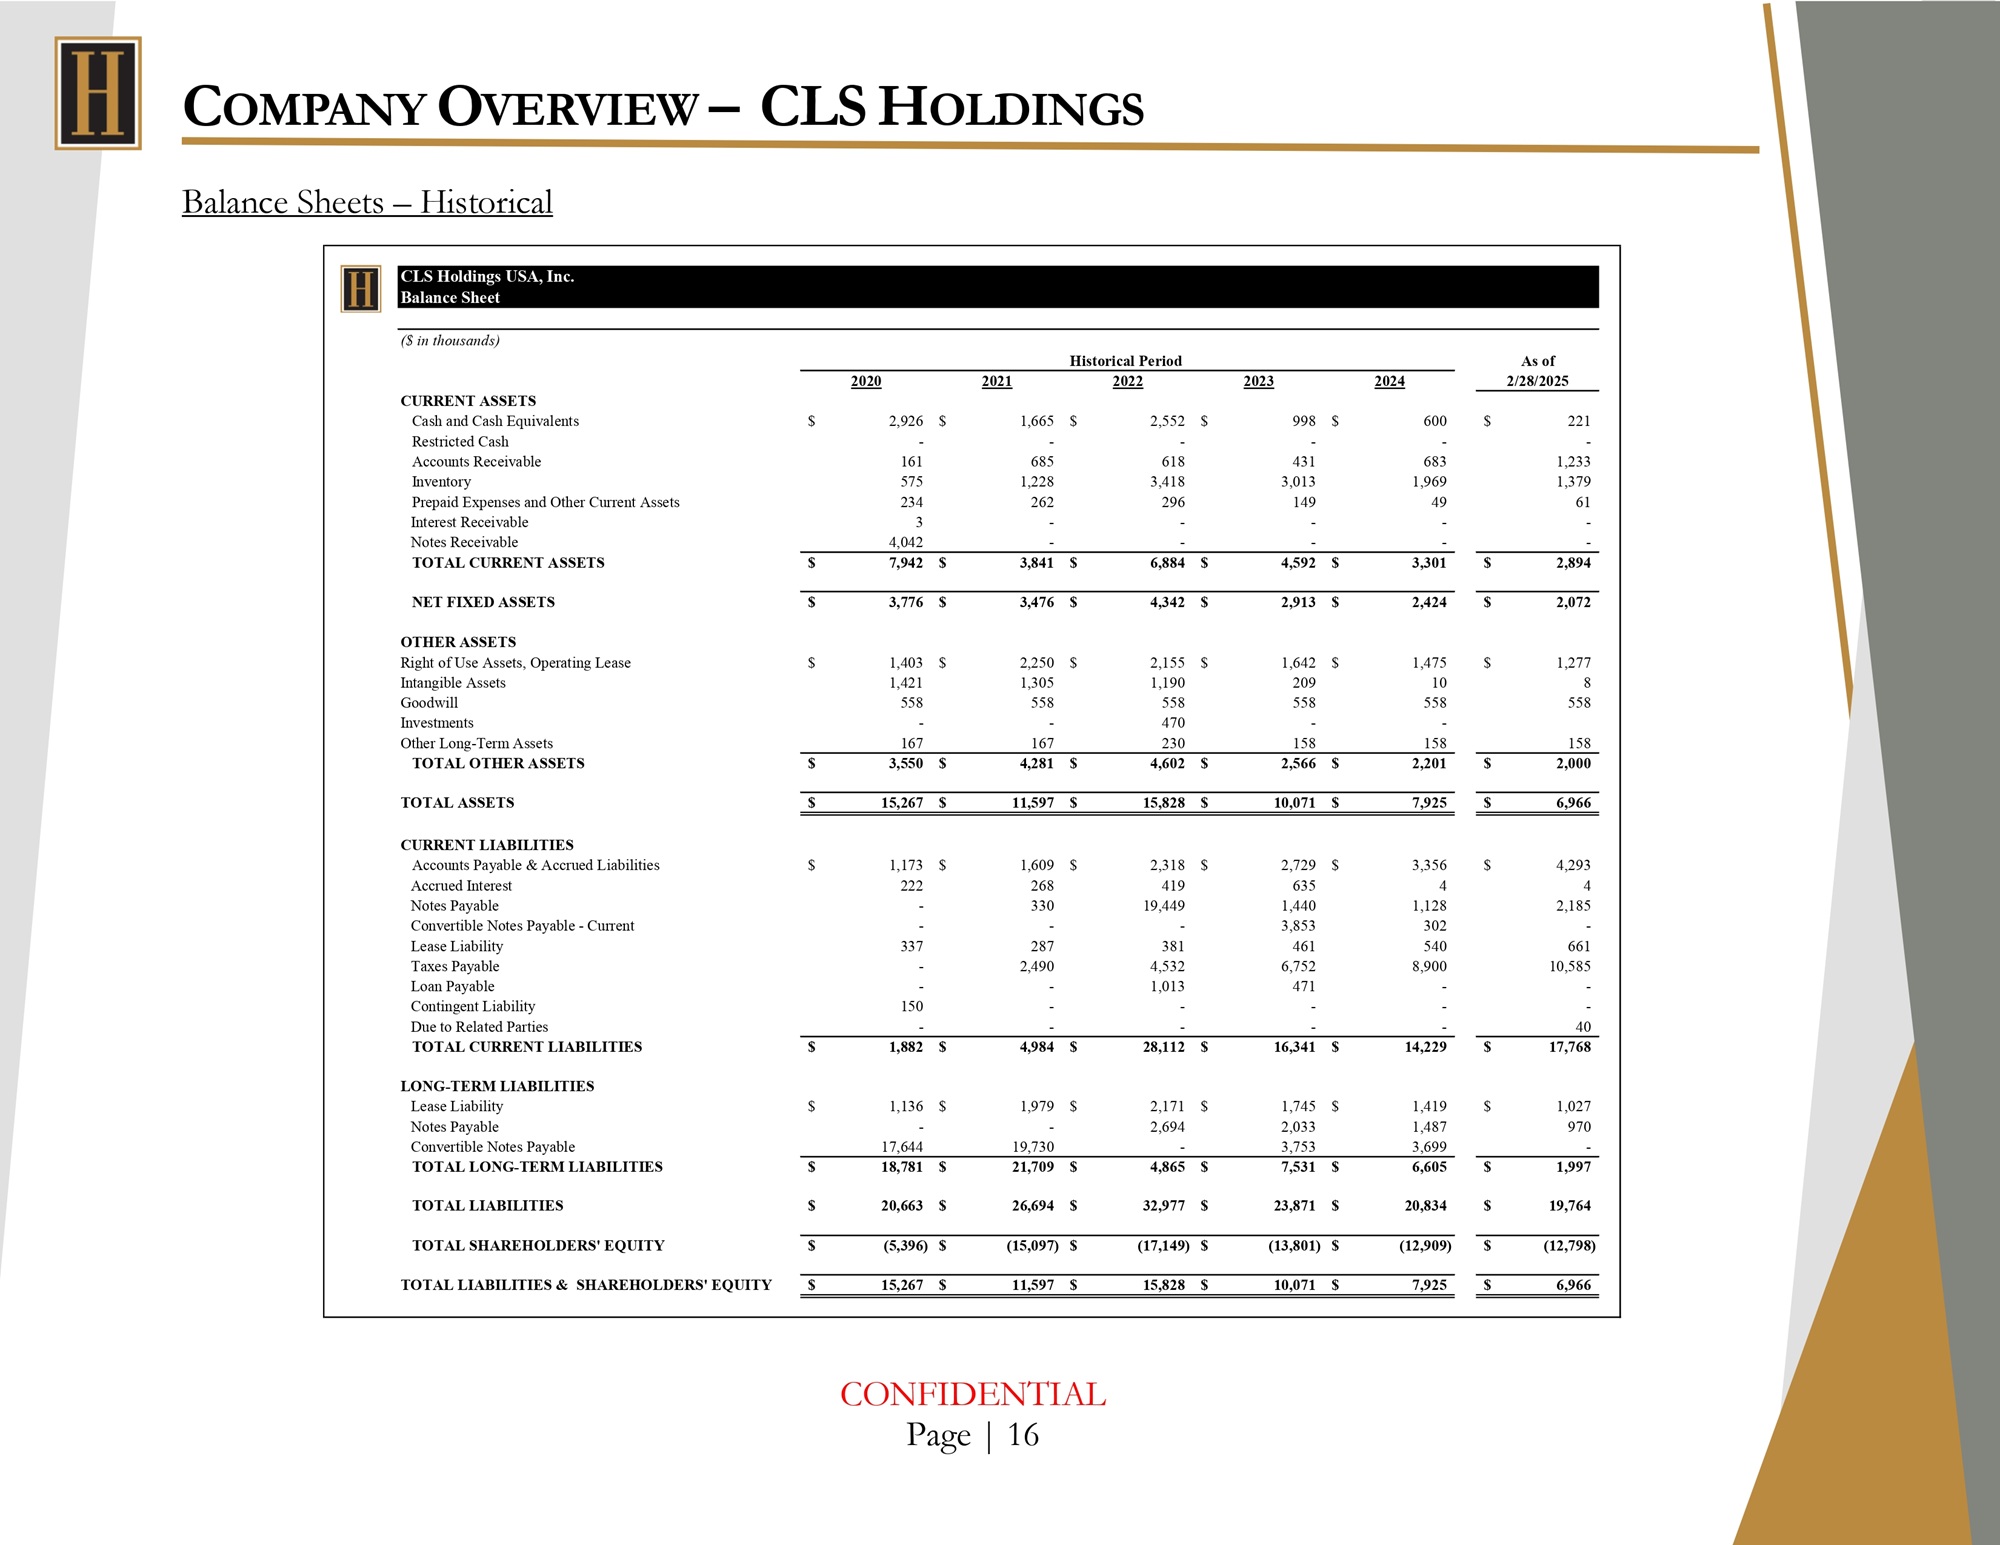
C OMPANY O VERVIEW – CLS H OLDINGS Balance Sheets – Historical CONFIDENTIAL Page | 16 CLS Holdings USA, Inc. Balance Sheet As of Historical Period ($ in thousands) 2/28/2025 2024 2023 2022 2021 2020 $ 221 $ 600 $ 998 $ 2,552 $ 1,665 $ 2,926 CURRENT ASSETS Cash and Cash Equivalents - - - - - - Restricted Cash 1,233 683 431 618 685 161 Accounts Receivable 1,379 1,969 3,013 3,418 1,228 575 Inventory 61 49 149 296 262 234 Prepaid Expenses and Other Current Assets - - - - - 3 Interest Receivable - - - - - 4,042 Notes Receivable $ 2,894 $ 3,301 $ 4,592 $ 6,884 $ 3,841 $ 7,942 TOTAL CURRENT ASSETS $ 2,072 $ 2,424 $ 2,913 $ 4,342 $ 3,476 $ 3,776 NET FIXED ASSETS $ 1,277 $ 1,475 $ 1,642 $ 2,155 $ 2,250 $ 1,403 OTHER ASSETS Right of Use Assets, Operating Lease 8 10 209 1,190 1,305 1,421 Intangible Assets 558 558 558 558 558 558 Goodwill - - 470 - - Investments 158 158 158 230 167 167 Other Long - Term Assets $ 2,000 $ 2,201 $ 2,566 $ 4,602 $ 4,281 $ 3,550 TOTAL OTHER ASSETS $ 6,966 $ 7,925 $ 10,071 $ 15,828 $ 11,597 $ 15,267 TOTAL ASSETS $ 4,293 $ 3,356 $ 2,729 $ 2,318 $ 1,609 $ 1,173 CURRENT LIABILITIES Accounts Payable & Accrued Liabilities 4 4 635 419 268 222 Accrued Interest 2,185 1,128 1,440 19,449 330 - Notes Payable - 302 3,853 - - - Convertible Notes Payable - Current 661 540 461 381 287 337 Lease Liability 10,585 8,900 6,752 4,532 2,490 - Taxes Payable - - 471 1,013 - - Loan Payable - - - - - 150 Contingent Liability 40 - - - - - Due to Related Parties $ 17,768 $ 14,229 $ 16,341 $ 28,112 $ 4,984 $ 1,882 TOTAL CURRENT LIABILITIES $ 1,027 $ 1,419 $ 1,745 $ 2,171 $ 1,979 $ 1,136 LONG - TERM LIABILITIES Lease Liability 970 1,487 2,033 2,694 - - Notes Payable - 3,699 3,753 - 19,730 17,644 Convertible Notes Payable $ 1,997 $ 6,605 $ 7,531 $ 4,865 $ 21,709 $ 18,781 TOTAL LONG - TERM LIABILITIES $ 19,764 $ 20,834 $ 23,871 $ 32,977 $ 26,694 $ 20,663 TOTAL LIABILITIES (12,798) $ (12,909) (13,801) $ (17,149) $ (15,097) $ (5,396) $ $ TOTAL SHAREHOLDERS' EQUITY 6,966 $ 7,925 10,071 $ 15,828 $ 11,597 $ 15,267 $ $ TOTAL LIABILITIES & SHAREHOLDERS' EQUITY
F AIRNESS O PINION O VERVIEW In assessing whether the consideration to be issued or exchanged in the Transaction to the shareholders of the Company is fair from a financial point of view to the Company and its shareholders, Houlihan Capital compared our estimated fair value of the equity of the Company on a per share basis to the Transaction Price . If the per share value of the Transaction is above the range of values implied by the analysis then the Transaction is fair from a financial point of view to the shareholders of the Company . The following pages discuss Houlihan Capital’s valuation of the Company’s equity value per share as of April 8 , 2025 (the “Date of Value”) . CONFIDENTIAL Page | 17
V ALUATION M ETHODOLOGIES There are three primary approaches that have traditionally been used to estimate fair value : the adjusted book value approach, the income approach, and the market approach . The adjusted book value approach estimates fair value based on the principle of substitution by assuming a prudent investor would pay no more for an asset than the amount for which the asset or property could be reproduced or replaced, less depreciation from physical deterioration and functional and economic obsolescence, if present and measurable . This approach is typically considered appropriate for highly capital - intensive businesses, real estate holding companies, or other types of holding companies where the value of the entity is derived primarily from the underlying assets held by the entity and not from additional value added from labor or profitable use of the assets owned . This valuation approach may also be used to value companies that are in bankruptcy or liquidation, or those that are otherwise not considered a going concern . In conducting the valuation analysis, Houlihan Capital leveraged the availability of a Level 1 input, specifically the market price of the Company, which is actively traded on the over - the - counter market (“OTC”) . As such, Houlihan Capital did not utilize the adjusted book value approach in support of the Opinion . The market approach references actual transactions of the asset to be valued, similar assets, or assets that can otherwise be used to infer the value of the subject asset . The application of methods, namely the Guideline Public Company Method, within the market approach often requires identifying companies comparable to a subject company, observing transaction prices of those companies’ securities, deriving valuation multiples based on the ratio of such transaction prices to financial metrics (e . g . , EBITDA, Tangible Book Value, Book Value), and then applying selected valuation multiples to the subject company’s same financial metrics . Houlihan Capital was able to identify a sufficient number of guideline public companies that were considered reasonably similar to the Company . As such, Houlihan Capital utilized the Guideline Public Company Method under the market approach in support of the Opinion . The Comparable Transactions Method is another commonly used method under the Market Approach . This valuation method involves determining valuation multiples from sales of companies with financial and CONFIDENTIAL Page | 18
V ALUATION M ETHODOLOGIES operating characteristics considered reasonably similar to those of the company being valued and applying representative multiples to the financial metrics of the subject company to estimate value, similar to the Guideline Public Company Method . Houlihan Capital was able to identify a sufficiently robust set of transactions involving target companies considered reasonably similar to the Company for which publicly disclosed data to calculate and adjust valuation multiples was available . As such, Houlihan Capital utilized the Comparable Transactions Method under the market approach in support of the Opinion . The income approach is a calculation of the present value of the future monetary benefits expected to flow to the owner of the subject asset. A commonly applied methodology under the Income Approach is the Discounted Cash Flow (“DCF”) Method. Using a DCF analysis, value is indicated from all the future cash flows attributable to the firm or asset, discounted to present value at an appropriate required rate of return. An forecast suitable to perform a comprehensive DCF analysis and guidance from Company management was not available to Houlihan Capital beyond the next three years. As such, Houlihan Capital did not utilize the income approach in support of the Opinion. Summary In determining the value of the Target, the following approaches were employed: » Market Approach - Guideline Public Company Method » Market Approach - Comparable Transactions Method CONFIDENTIAL Page | 19
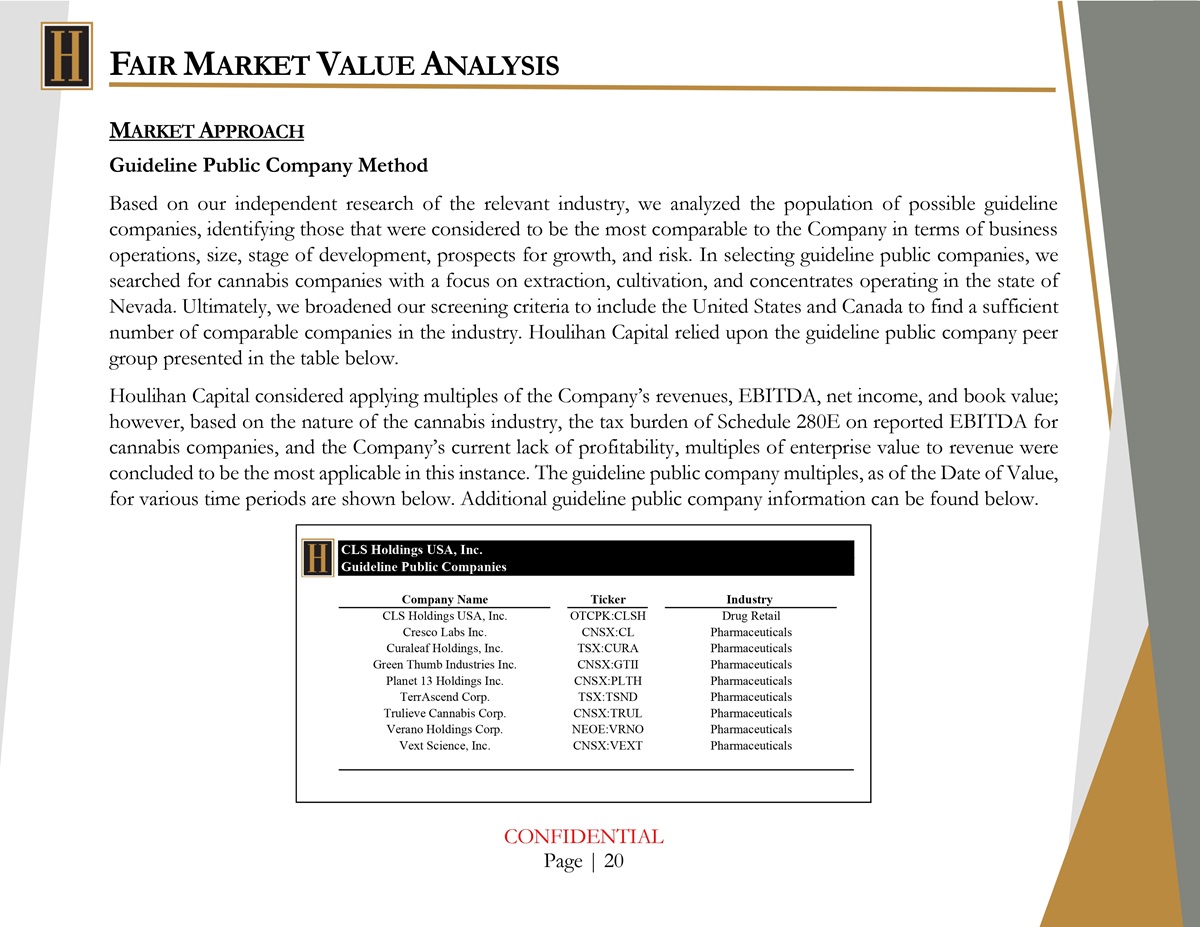
F AIR M ARKET V ALUE A NALYSIS M ARKET A PPROACH Guideline Public Company Method Based on our independent research of the relevant industry, we analyzed the population of possible guideline companies, identifying those that were considered to be the most comparable to the Company in terms of business operations, size, stage of development, prospects for growth, and risk . In selecting guideline public companies, we searched for cannabis companies with a focus on extraction, cultivation, and concentrates operating in the state of Nevada . Ultimately, we broadened our screening criteria to include the United States and Canada to find a sufficient number of comparable companies in the industry . Houlihan Capital relied upon the guideline public company peer group presented in the table below . Houlihan Capital considered applying multiples of the Company’s revenues, EBITDA, net income, and book value ; however, based on the nature of the cannabis industry, the tax burden of Schedule 280 E on reported EBITDA for cannabis companies, and the Company’s current lack of profitability, multiples of enterprise value to revenue were concluded to be the most applicable in this instance . The guideline public company multiples, as of the Date of Value, for various time periods are shown below . Additional guideline public company information can be found below . CLS Holdings USA, Inc. Guideline Public Companies Industry Ticker Company Name Drug Retail OTCPK:CLSH CLS Holdings USA, Inc. Pharmaceuticals CNSX:CL Cresco Labs Inc. Pharmaceuticals TSX:CURA Curaleaf Holdings, Inc. Pharmaceuticals CNSX:GTII Green Thumb Industries Inc. Pharmaceuticals CNSX:PLTH Planet 13 Holdings Inc. Pharmaceuticals TSX:TSND TerrAscend Corp. Pharmaceuticals CNSX:TRUL Trulieve Cannabis Corp. Pharmaceuticals NEOE:VRNO Verano Holdings Corp. Pharmaceuticals CNSX:VEXT Vext Science, Inc. CONFIDENTIAL Page | 20
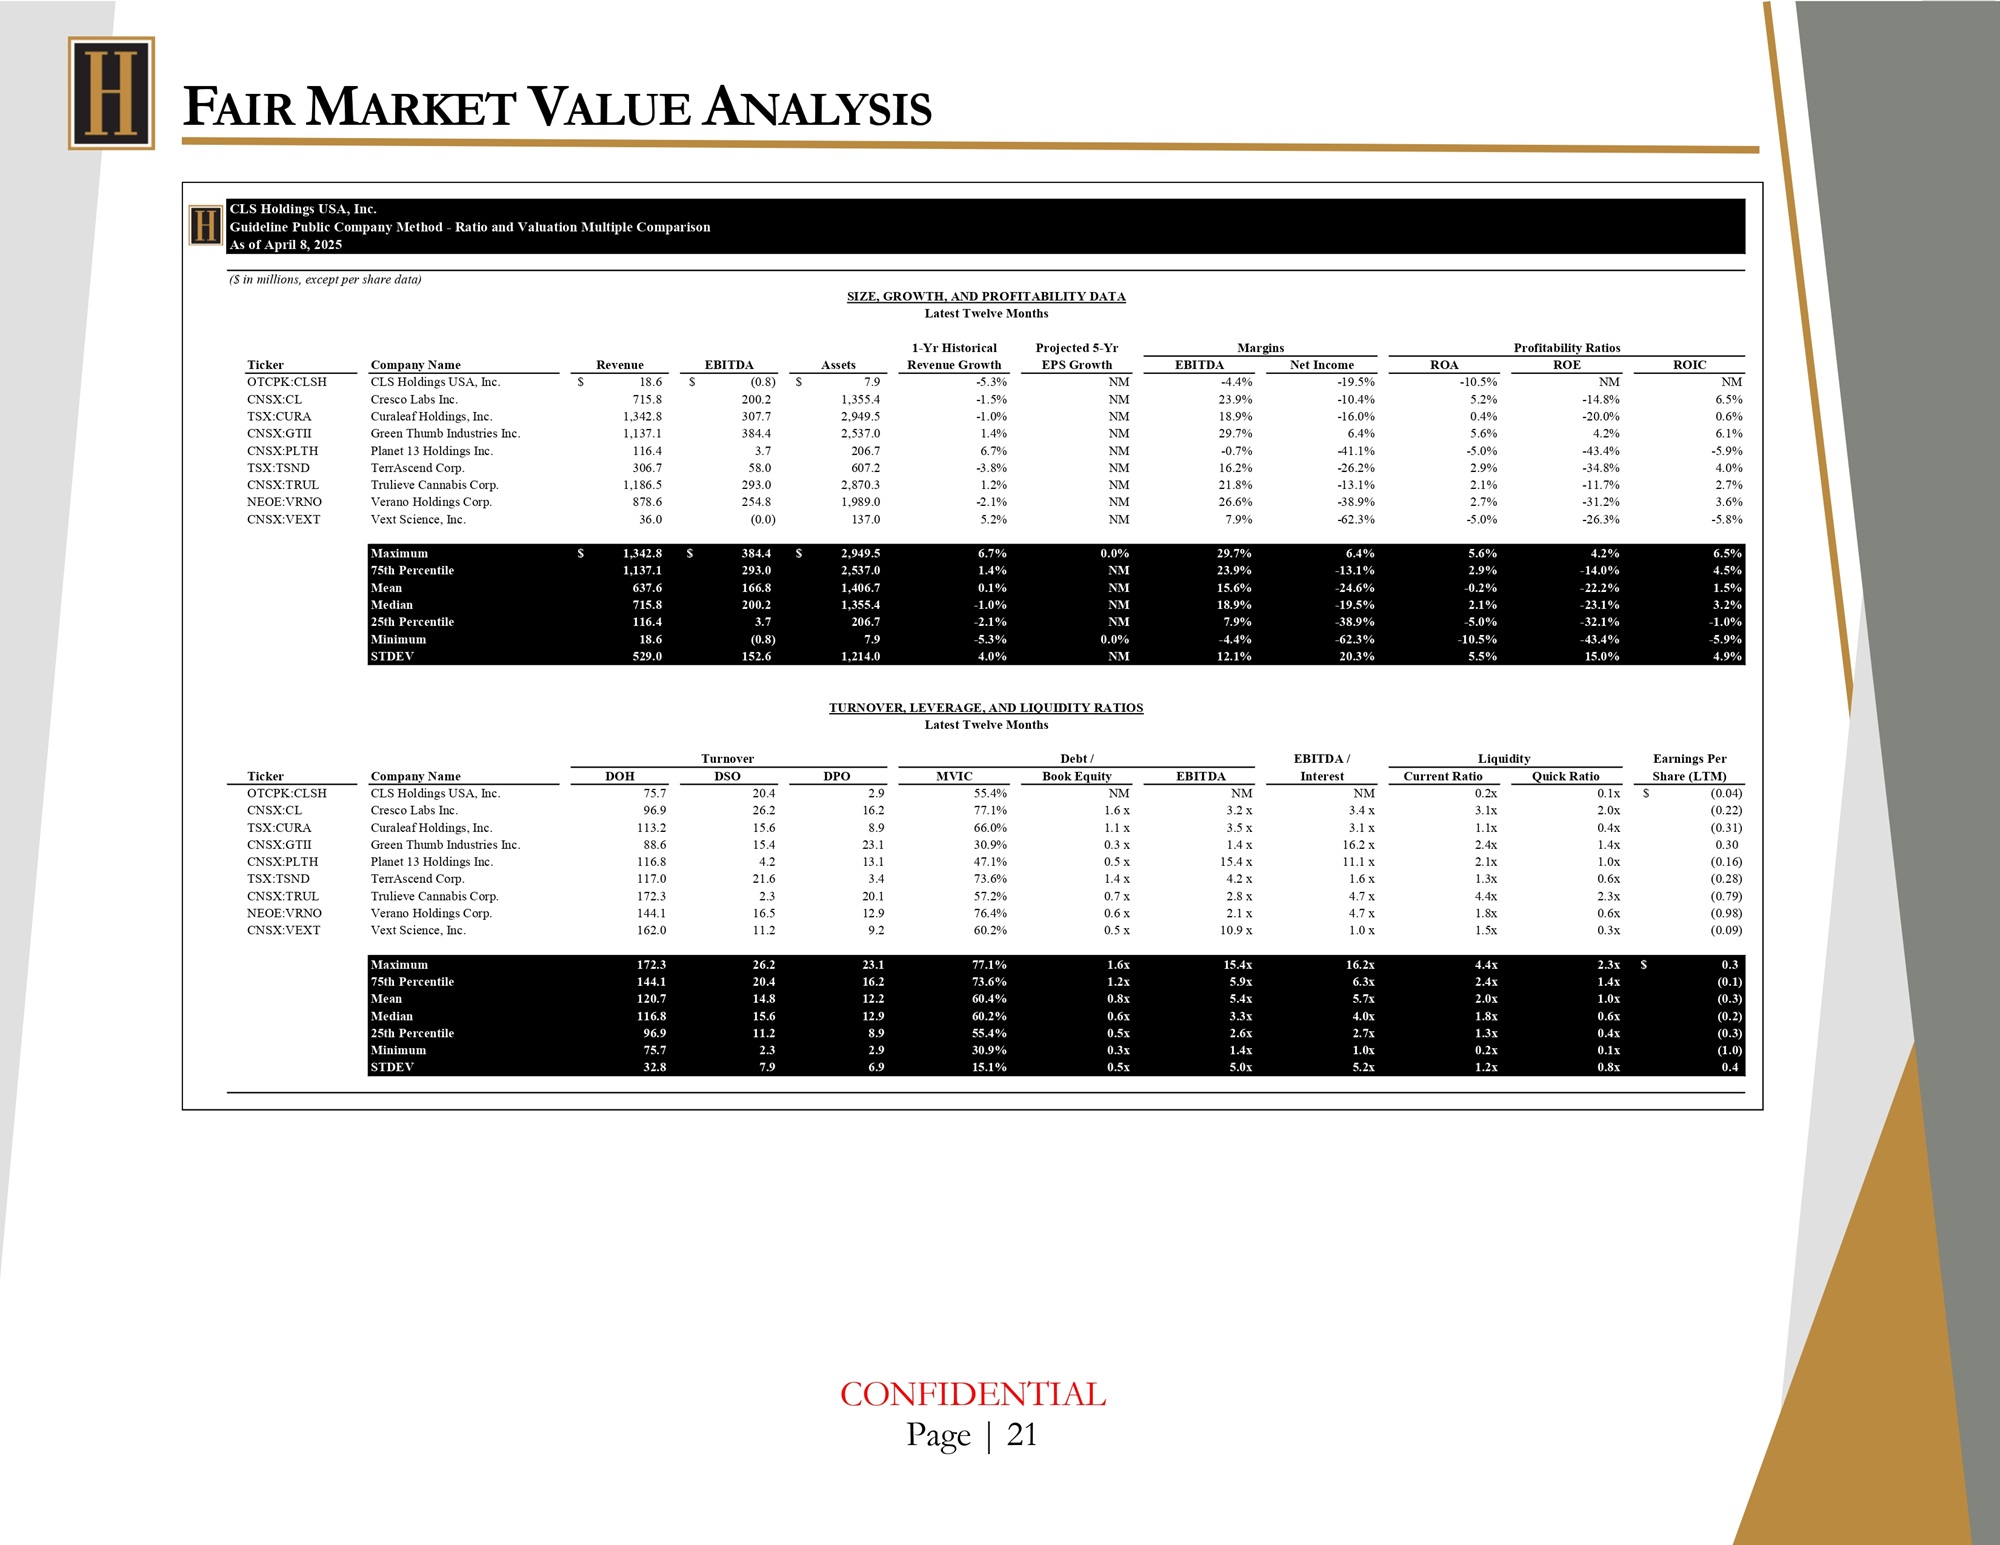
F AIR M ARKET V ALUE A NALYSIS CLS Holdings USA, Inc. Guideline Public Company Method - Ratio and Valuation Multiple Comparison As of April 8, 2025 ($ in millions, except per share data) SIZE, GROWTH, AND PROFITABILITY DATA Latest Twelve Months Margins Profitability Ratios Ticker Company Name Revenue EBITDA Assets 1 - Yr Historical Revenue Growth Projected 5 - Yr EPS Growth EBITDA Net Income ROA ROE ROIC $ $ OTCPK:CLSH CNSX:CL TSX:CURA CNSX:GTII CNSX:PLTH TSX:TSND CNSX:TRUL NEOE:VRNO CNSX:VEXT CLS Holdings USA, Inc. Cresco Labs Inc. Curaleaf Holdings, Inc. Green Thumb Industries Inc. Planet 13 Holdings Inc. TerrAscend Corp. Trulieve Cannabis Corp. Verano Holdings Corp. Vext Science, Inc. 18.6 715.8 1,342.8 1,137.1 116.4 306.7 1,186.5 878.6 36.0 (0.8) $ 200.2 307.7 384.4 3.7 58.0 293.0 254.8 (0.0) 7.9 1,355.4 2,949.5 2,537.0 206.7 607.2 2,870.3 1,989.0 137.0 - 5.3% - 1.5% - 1.0% 1.4% 6.7% - 3.8% 1.2% - 2.1% 5.2% NM NM NM NM NM NM NM NM NM - 4.4% 23.9% 18.9% 29.7% - 0.7% 16.2% 21.8% 26.6% 7.9% - 19.5% - 10.4% - 16.0% 6.4% - 41.1% - 26.2% - 13.1% - 38.9% - 62.3% - 10.5% 5.2% 0.4% 5.6% - 5.0% 2.9% 2.1% 2.7% - 5.0% NM - 14.8% - 20.0% 4.2% - 43.4% - 34.8% - 11.7% - 31.2% - 26.3% NM 6.5% 0.6% 6.1% - 5.9% 4.0% 2.7% 3.6% - 5.8% $ Maximum 75th Percentile Mean Median 25th Percentile Minimum STDEV 1,342.8 $ 1,137.1 637.6 715.8 116.4 18.6 529.0 384.4 $ 293.0 166.8 200.2 3.7 (0.8) 152.6 2,949.5 2,537.0 1,406.7 1,355.4 206.7 7.9 1,214.0 6.7% 1.4% 0.1% - 1.0% - 2.1% - 5.3% 4.0% 0 . 0 % NM NM NM NM 0 . 0 % NM 29.7% 23.9% 15.6% 18.9% 7.9% - 4.4% 12.1% 6.4% - 13.1% - 24.6% - 19.5% - 38.9% - 62.3% 20.3% 5.6% 2.9% - 0.2% 2.1% - 5.0% - 10.5% 5.5% 4.2% - 14.0% - 22.2% - 23.1% - 32.1% - 43.4% 15.0% 6.5% 4.5% 1.5% 3.2% - 1.0% - 5.9% 4.9% TURNOVER, LEVERAGE, AND LIQUIDITY RATIOS Latest Twelve Months Turnover Debt / Liquidity Ticker Company Name DOH DSO DPO MVIC Book Equity EBITDA EBITDA / Interest Current Ratio Quick Ratio Earnings Per Share (LTM) OTCPK:CLSH CLS Holdings USA, Inc. 75.7 20.4 2.9 55.4% NM NM NM 0.2x (0.04) 0.1x $ CNSX:CL TSX:CURA CNSX:GTII CNSX:PLTH TSX:TSND CNSX:TRUL NEOE:VRNO CNSX:VEXT Cresco Labs Inc. Curaleaf Holdings, Inc. Green Thumb Industries Inc. Planet 13 Holdings Inc. TerrAscend Corp. Trulieve Cannabis Corp. Verano Holdings Corp. Vext Science, Inc. 96.9 113.2 88.6 116.8 117.0 172.3 144.1 162.0 26.2 15.6 15.4 4.2 21.6 2.3 16.5 11.2 16.2 8.9 23.1 13.1 3.4 20.1 12.9 9.2 77.1% 66.0% 30.9% 47.1% 73.6% 57.2% 76.4% 60.2% 1.6 x 1.1 x 0.3 x 0.5 x 1.4 x 0.7 x 0.6 x 0.5 x 3.2 x 3.5 x 1.4 x 15.4 x 4.2 x 2.8 x 2.1 x 10.9 x 3.4 x 3.1 x 16.2 x 11.1 x 1.6 x 4.7 x 4.7 x 1.0 x 3.1x 1.1x 2.4x 2.1x 1.3x 4.4x 1.8x 1.5x 2.0x 0.4x 1.4x 1.0x 0.6x 2.3x 0.6x 0.3x (0.22) (0.31) 0.30 (0.16) (0.28) (0.79) (0.98) (0.09) Maximum 75th Percentile Mean Median 25th Percentile Minimum STDEV 172.3 144.1 120.7 116.8 96.9 75.7 32.8 26.2 20.4 14.8 15.6 11.2 2.3 7.9 23.1 16.2 12.2 12.9 8.9 2.9 6.9 77.1% 73.6% 60.4% 60.2% 55.4% 30.9% 15.1% 1.6x 1.2x 0.8x 0.6x 0.5x 0.3x 0.5x 15.4x 5.9x 5.4x 3.3x 2.6x 1.4x 5.0x 16.2x 6.3x 5.7x 4.0x 2.7x 1.0x 5.2x 4.4x 2.4x 2.0x 1.8x 1.3x 0.2x 1.2x 2.3x $ 1.4x 1.0x 0.6x 0.4x 0.1x 0.8x 0.3 (0.1) (0.3) (0.2) (0.3) (1.0) 0.4 CONFIDENTIAL Page | 21
F AIR M ARKET V ALUE A NALYSIS CLS Holdings USA, Inc. Guideline Public Company: Multiples at Date of Value As of April 8, 2025 CONFIDENTIAL Page | 22 2026F 2025F LTM Company Name Ticker N/A N/A 0.47x CLS Holdings USA, Inc. OTCPK:CLSH 0.85x 0.88x 0.85x Cresco Labs Inc. CNSX:CL 1.15x 1.22x 1.23x Curaleaf Holdings, Inc. TSX:CURA 1.26x 1.32x 1.37x Green Thumb Industries Inc. CNSX:GTII N/A 0.74x 0.84x Planet 13 Holdings Inc. CNSX:PLTH 1.00x 1.02x 1.01x TerrAscend Corp. TSX:TSND 0.92x 0.95x 0.96x Trulieve Cannabis Corp. CNSX:TRUL 0.66x 0.68x 0.68x Verano Holdings Corp. NEOE:VRNO 0.76x 1.30x 1.71x Vext Science, Inc. CNSX:VEXT 1.26x 1.32x 1.71x Max 1.08x 1.24x 1.23x 75th Percentile 0.94x 1.01x 1.01x Mean 0.92x 0.98x 0.96x Median 0.80x 0.84x 0.84x 25th Percentile 0.66x 0.68x 0.47x Min Enterprise Value / Revenue
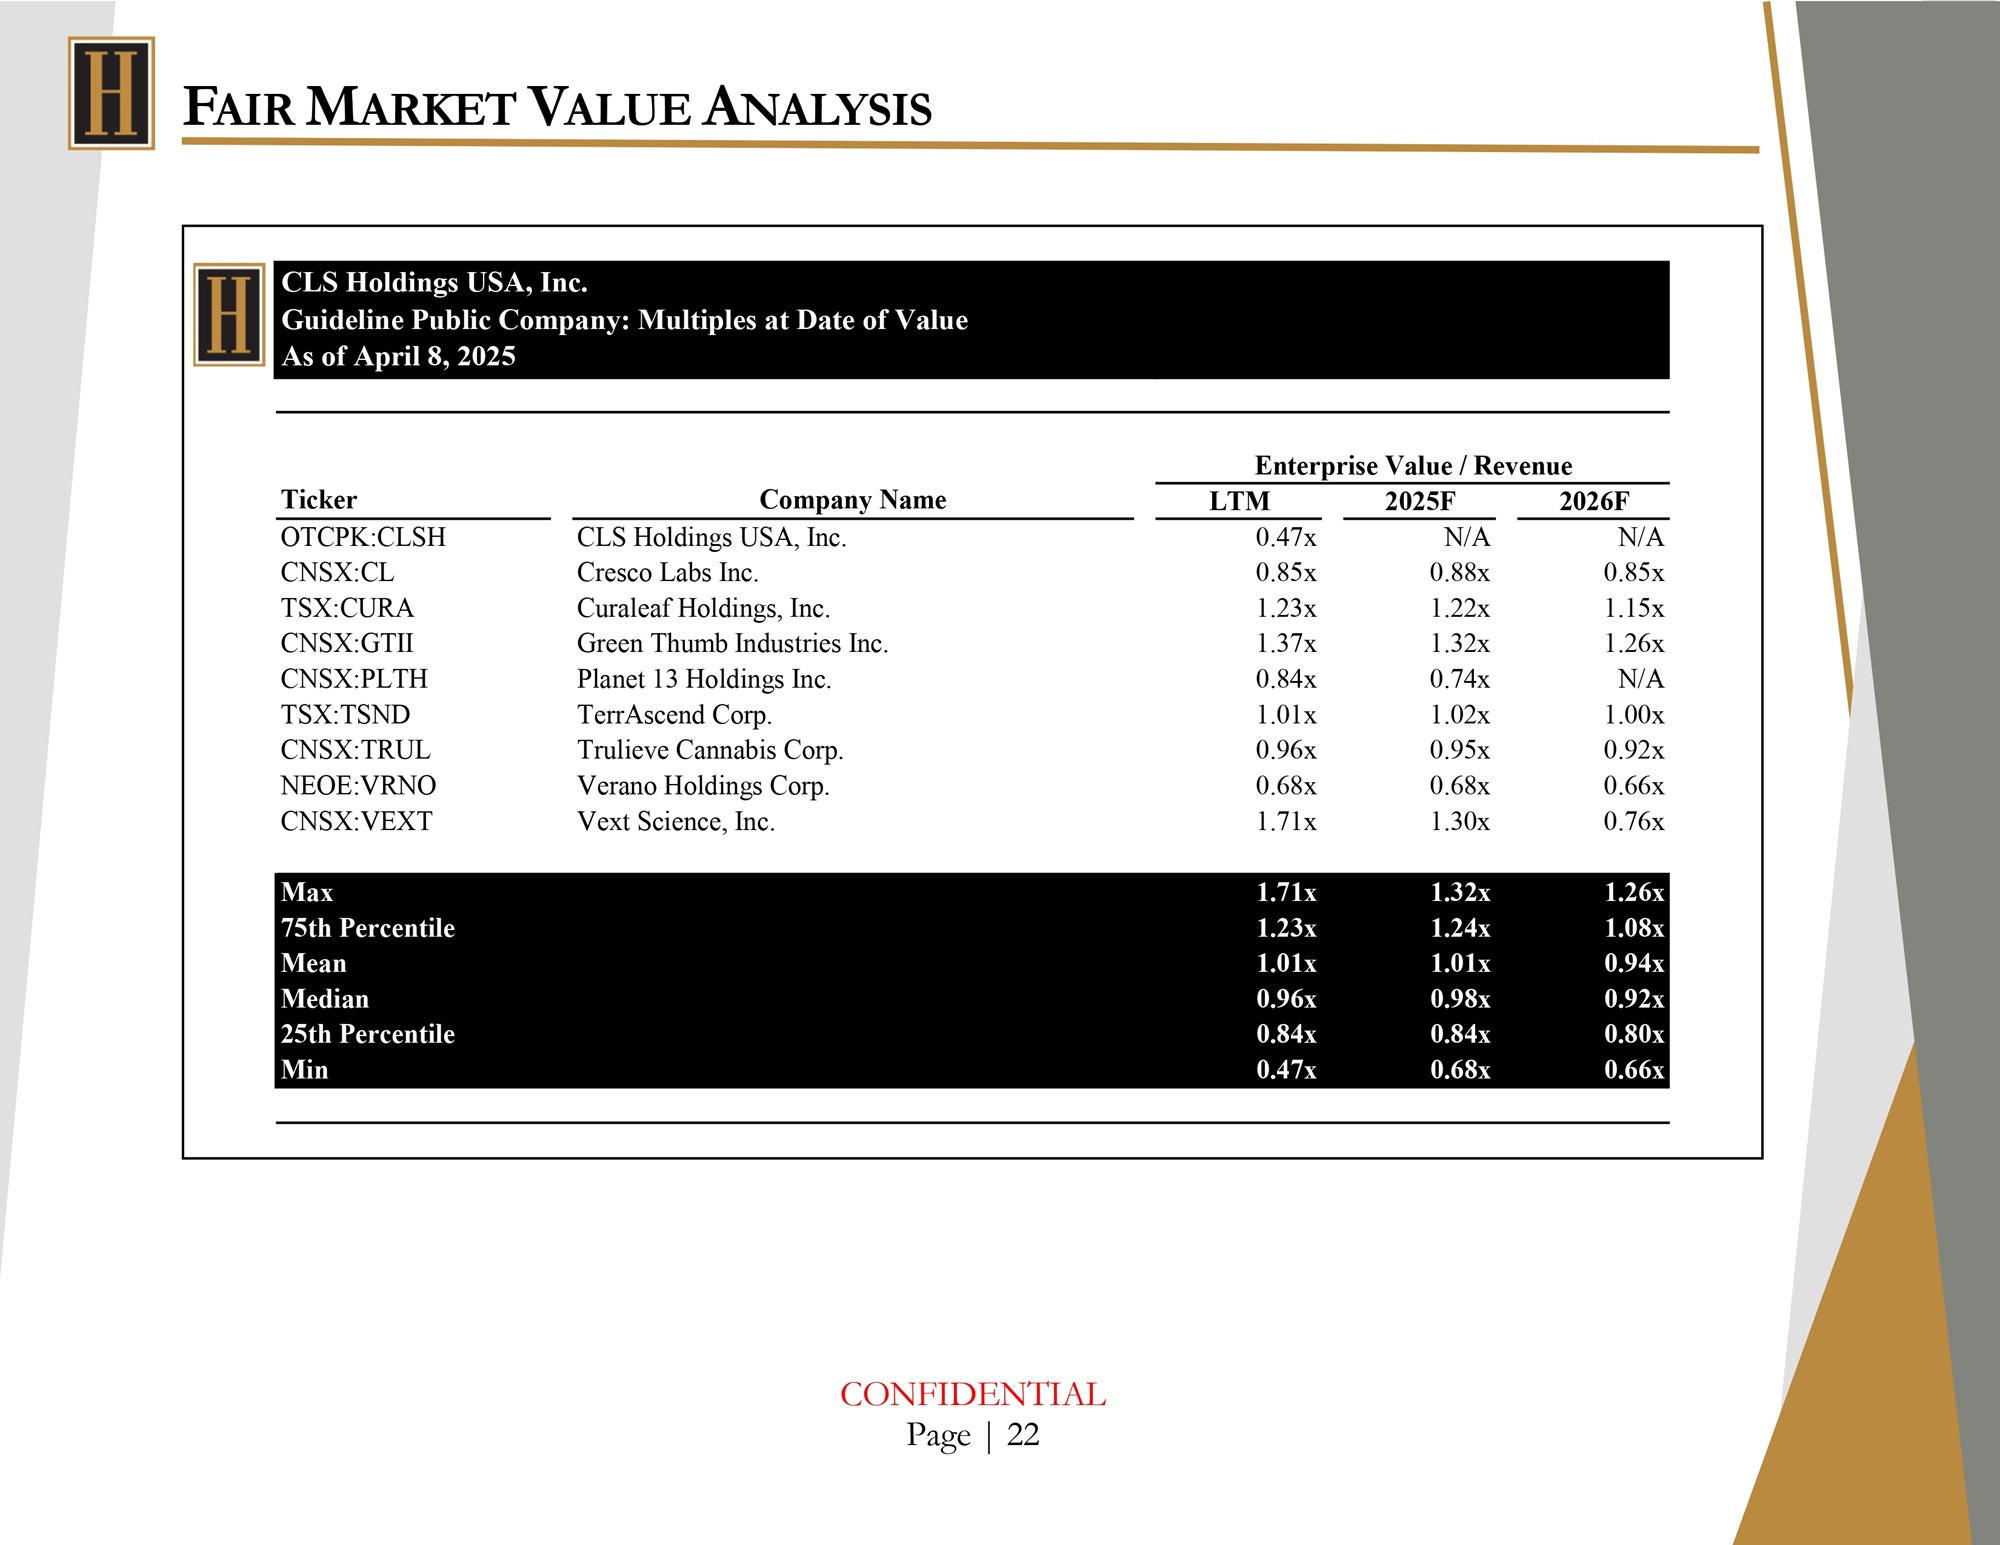
F AIR M ARKET V ALUE A NALYSIS In valuing the Company, Houlihan applied multiples of last twelve months (“LTM”), calendar year 2025 , and 2026 revenue . Houlihan Capital believes these time periods strike a balance between reliability, visibility, and growth potential . The selection of a valuation multiple is largely a qualitative exercise that is informed by quantitative measures . In selecting the multiples to apply to the Company, Houlihan Capital reviewed the growth expectations, size, cash flow margins, and other risk factors of the Company and the guideline public companies . Based on this information and other factors, Houlihan Capital used professional judgment to select multiples that reflect the relative comparability of the Company to the guideline public companies . A summary of the analysis includes the following : Growth . Historical and expected growth has a direct impact on the value of a company . Investors are willing to attribute higher multiples to firms whose revenues and earnings are growing more rapidly than their competitors . Superior earnings growth is also an indication of the competitive position of a company, with more successful firms able to grow faster than the industry . In calendar year 2022 the Company achieved a revenue growth rate in line with the median of the guideline public companies of 10 . 9 % . However, in the following two years the industry median dropped to - 1 . 7 % and - 0 . 3 % , respectively . Over the contemporaneous period the Company experienced negative revenue growth rates of - 10 . 6 % and - 12 . 7 % , respectively . For the three calendar years ending 2025 , 2026 , and 2027 the peer group is projected to grow revenues by a wide range of - 2 . 7 % to 71 . 2 % with median revenue growth rates of 0 . 9 % , 3 . 6 % , and 3 . 9 % , respectively . The Company is expected to experience a decline in revenue for calendar year 2025 of - 16 . 8 % before achieving revenue growth rates of 2 . 9 % and 3 . 0 % in the following two years . Size . There is generally an inverse relationship between a company’s size and the level of investment risk . Larger companies are often more geographically diversified which makes it easier to enter into new markets . Large companies also have greater access to capital markets than small companies . Investors typically expect smaller, less diversified businesses to have a higher amount of risk associated with their lack of financial size CONFIDENTIAL Page | 23
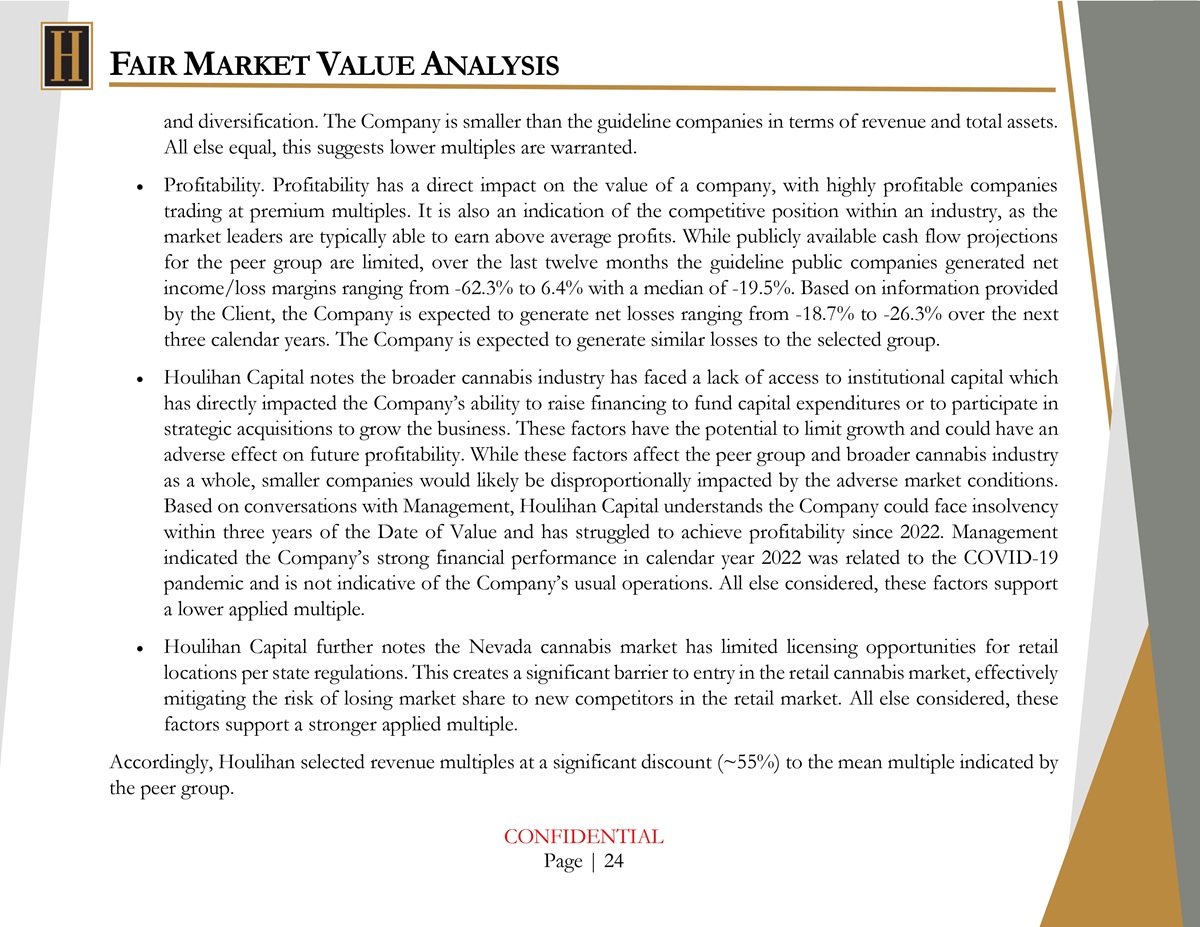
F AIR M ARKET V ALUE A NALYSIS and diversification . The Company is smaller than the guideline companies in terms of revenue and total assets . All else equal, this suggests lower multiples are warranted . Profitability . Profitability has a direct impact on the value of a company, with highly profitable companies trading at premium multiples . It is also an indication of the competitive position within an industry, as the market leaders are typically able to earn above average profits . While publicly available cash flow projections for the peer group are limited, over the last twelve months the guideline public companies generated net income/loss margins ranging from - 62 . 3 % to 6 . 4 % with a median of - 19 . 5 % . Based on information provided by the Client, the Company is expected to generate net losses ranging from - 18 . 7 % to - 26 . 3 % over the next three calendar years . The Company is expected to generate similar losses to the selected group . Houlihan Capital notes the broader cannabis industry has faced a lack of access to institutional capital which has directly impacted the Company’s ability to raise financing to fund capital expenditures or to participate in strategic acquisitions to grow the business . These factors have the potential to limit growth and could have an adverse effect on future profitability . While these factors affect the peer group and broader cannabis industry as a whole, smaller companies would likely be disproportionally impacted by the adverse market conditions . Based on conversations with Management, Houlihan Capital understands the Company could face insolvency within three years of the Date of Value and has struggled to achieve profitability since 2022 . Management indicated the Company’s strong financial performance in calendar year 2022 was related to the COVID - 19 pandemic and is not indicative of the Company’s usual operations . All else considered, these factors support a lower applied multiple . Houlihan Capital further notes the Nevada cannabis market has limited licensing opportunities for retail locations per state regulations . This creates a significant barrier to entry in the retail cannabis market, effectively mitigating the risk of losing market share to new competitors in the retail market . All else considered, these factors support a stronger applied multiple . Accordingly, Houlihan selected revenue multiples at a significant discount (~ 55 % ) to the mean multiple indicated by the peer group . CONFIDENTIAL Page | 24
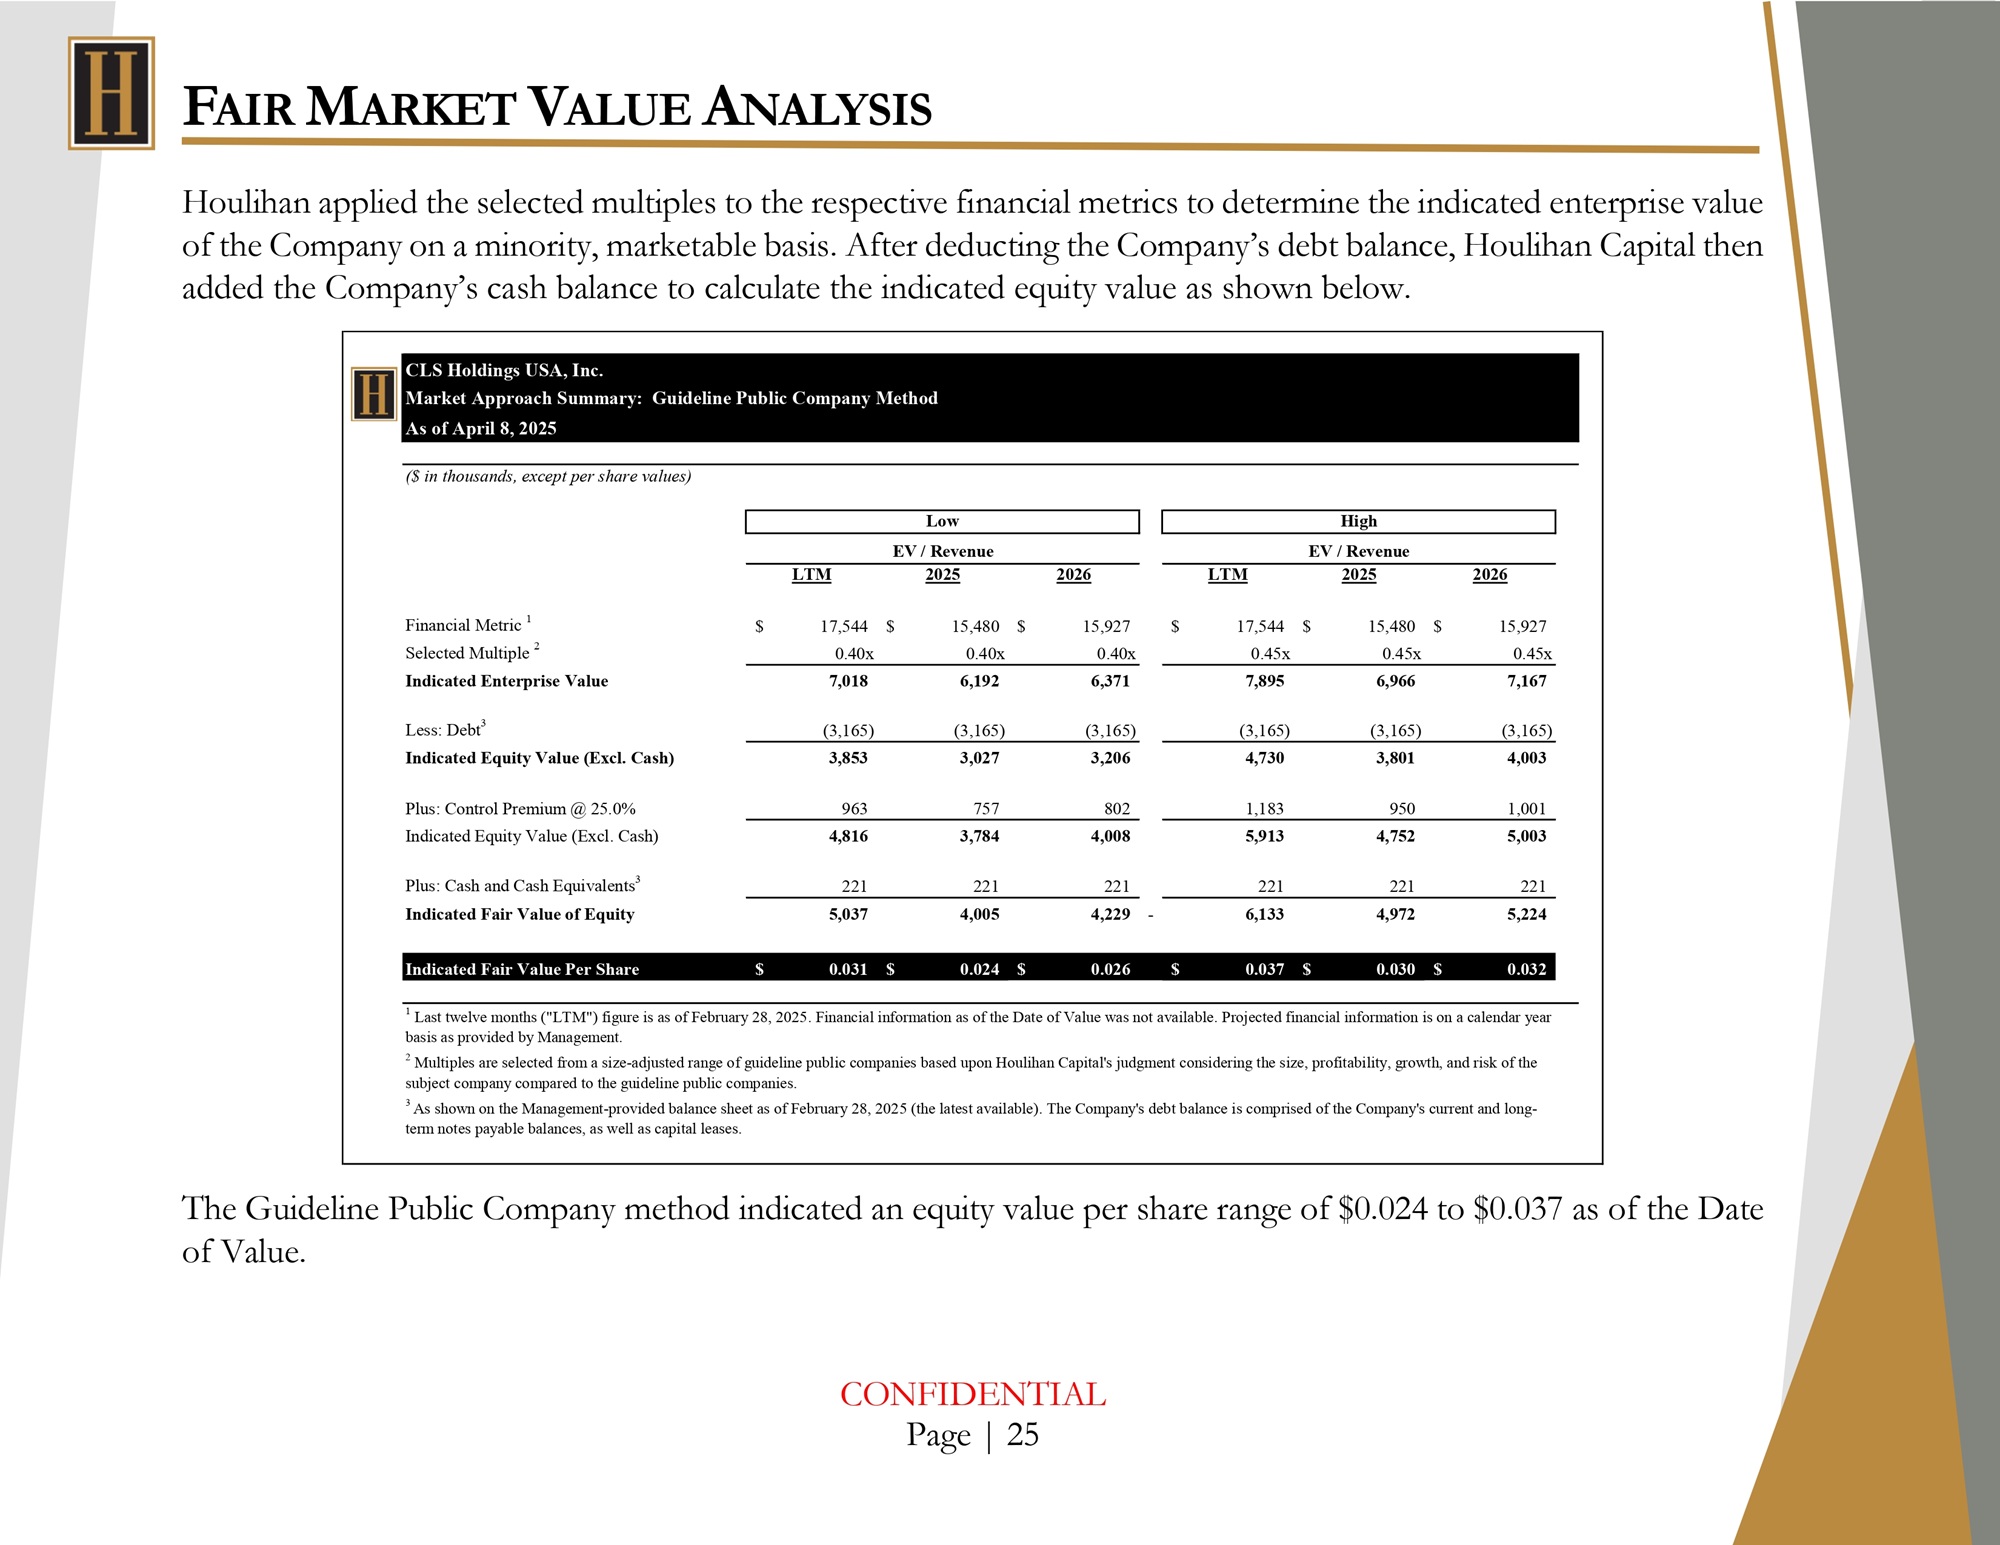
F AIR M ARKET V ALUE A NALYSIS Houlihan applied the selected multiples to the respective financial metrics to determine the indicated enterprise value of the Company on a minority, marketable basis . After deducting the Company’s debt balance, Houlihan Capital then added the Company’s cash balance to calculate the indicated equity value as shown below . The Guideline Public Company method indicated an equity value per share range of $0.024 to $0.037 as of the Date of Value. CLS Holdings USA, Inc. Market Approach Summary: Guideline Public Company Method As of April 8, 2025 ($ in thousands, except per share values) High Low EV / Revenue EV / Revenue 2026 2025 LTM 2026 2025 LTM $ 15,927 $ 15,480 $ 17,544 $ 15,927 $ 15,480 $ 17,544 Financial Metric 1 0.45x 0.45x 0.45x 0.40x 0.40x 0.40x Selected Multiple 2 7,167 6,966 7,895 6,371 6,192 7,018 Indicated Enterprise Value (3,165) (3,165) (3,165) (3,165) (3,165) (3,165) Less: Debt 3 4,003 3,801 4,730 3,206 3,027 3,853 Indicated Equity Value (Excl. Cash) 1,001 950 1,183 802 757 963 Plus: Control Premium @ 25.0% 5,003 4,752 5,913 4,008 3,784 4,816 Indicated Equity Value (Excl. Cash) 221 221 221 221 221 221 Plus: Cash and Cash Equivalents 3 5,224 4,972 - 6,133 4,229 4,005 5,037 Indicated Fair Value of Equity $ 0.032 $ 0.030 $ 0.037 $ 0.026 $ 0.024 $ 0.031 Indicated Fair Value Per Share 1 Last twelve months ("LTM") figure is as of February 28, 2025. Financial information as of the Date of Value was not available. Projected financial information is on a calendar year basis as provided by Management. 2 Multiples are selected from a size - adjusted range of guideline public companies based upon Houlihan Capital's judgment considering the size, profitability, growth, and risk of the subject company compared to the guideline public companies. 3 As shown on the Management - provided balance sheet as of February 28, 2025 (the latest available). The Company's debt balance is comprised of the Company's current and long - term notes payable balances, as well as capital leases. CONFIDENTIAL Page | 25
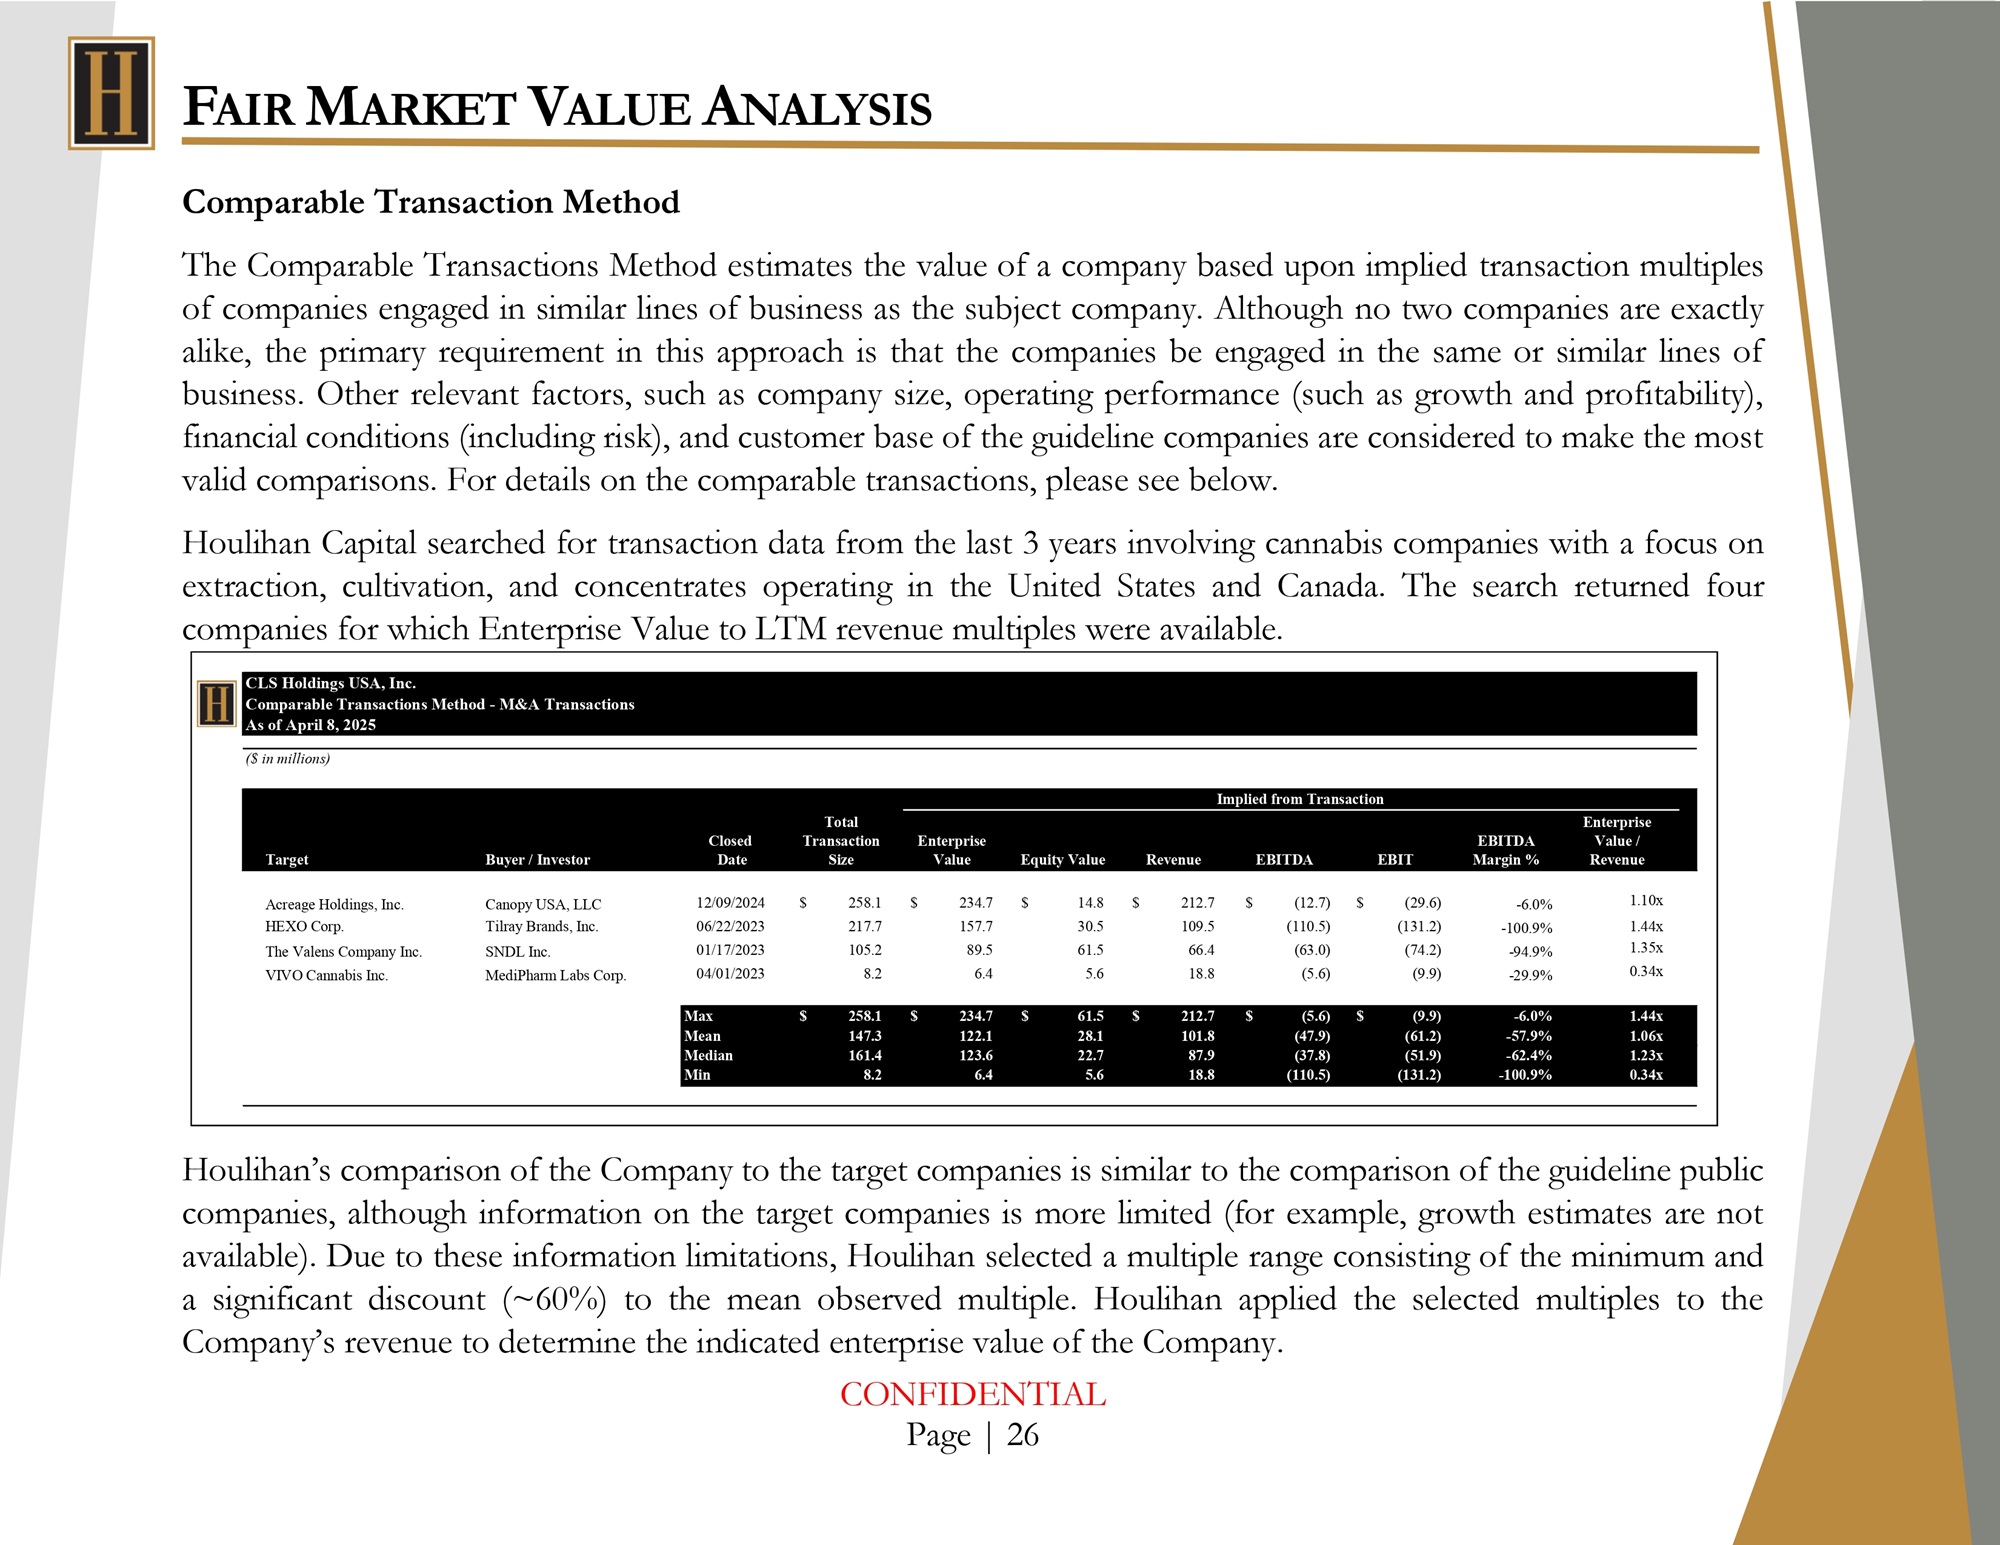
F AIR M ARKET V ALUE A NALYSIS Comparable Transaction Method The Comparable Transactions Method estimates the value of a company based upon implied transaction multiples of companies engaged in similar lines of business as the subject company . Although no two companies are exactly alike, the primary requirement in this approach is that the companies be engaged in the same or similar lines of business . Other relevant factors, such as company size, operating performance (such as growth and profitability), financial conditions (including risk), and customer base of the guideline companies are considered to make the most valid comparisons . For details on the comparable transactions, please see below . Houlihan Capital searched for transaction data from the last 3 years involving cannabis companies with a focus on extraction, cultivation, and concentrates operating in the United States and Canada . The search returned four companies for which Enterprise Value to LTM revenue multiples were available . Houlihan’s comparison of the Company to the target companies is similar to the comparison of the guideline public companies, although information on the target companies is more limited (for example, growth estimates are not available) . Due to these information limitations, Houlihan selected a multiple range consisting of the minimum and a significant discount (~ 60 % ) to the mean observed multiple . Houlihan applied the selected multiples to the Company’s revenue to determine the indicated enterprise value of the Company . CLS Holdings USA, Inc. Comparable Transactions Method - M&A Transactions As of April 8, 2025 ($ in millions) Implied from Transaction Target Buyer / Investor Total Closed Transaction Enterprise Date Size Value Equity Value Revenue EBITDA EBIT Enterprise EBITDA Value / Margin % Revenue 1.10x - 6.0% $ (29.6) $ (12.7) $ 212.7 $ 14.8 $ 234.7 $ 258.1 12/09/2024 Canopy USA, LLC Acreage Holdings, Inc. 1.44x - 100.9% (131.2) (110.5) 109.5 30.5 157.7 217.7 06/22/2023 Tilray Brands, Inc. HEXO Corp. 1.35x - 94.9% (74.2) (63.0) 66.4 61.5 89.5 105.2 01/17/2023 SNDL Inc. The Valens Company Inc. 0.34x - 29.9% (9.9) (5.6) 18.8 5.6 6.4 8.2 04/01/2023 MediPharm Labs Corp. VIVO Cannabis Inc. 1.44x - 6.0% $ (9.9) $ (5.6) $ 212.7 $ 61.5 $ 234.7 $ 258.1 Max 1.06x - 57.9% (61.2) (47.9) 101.8 28.1 122.1 147.3 Mean 1.23x - 62.4% (51.9) (37.8) 87.9 22.7 123.6 161.4 Median 0.34x - 100.9% (131.2) (110.5) 18.8 5.6 6.4 8.2 Min CONFIDENTIAL Page | 26
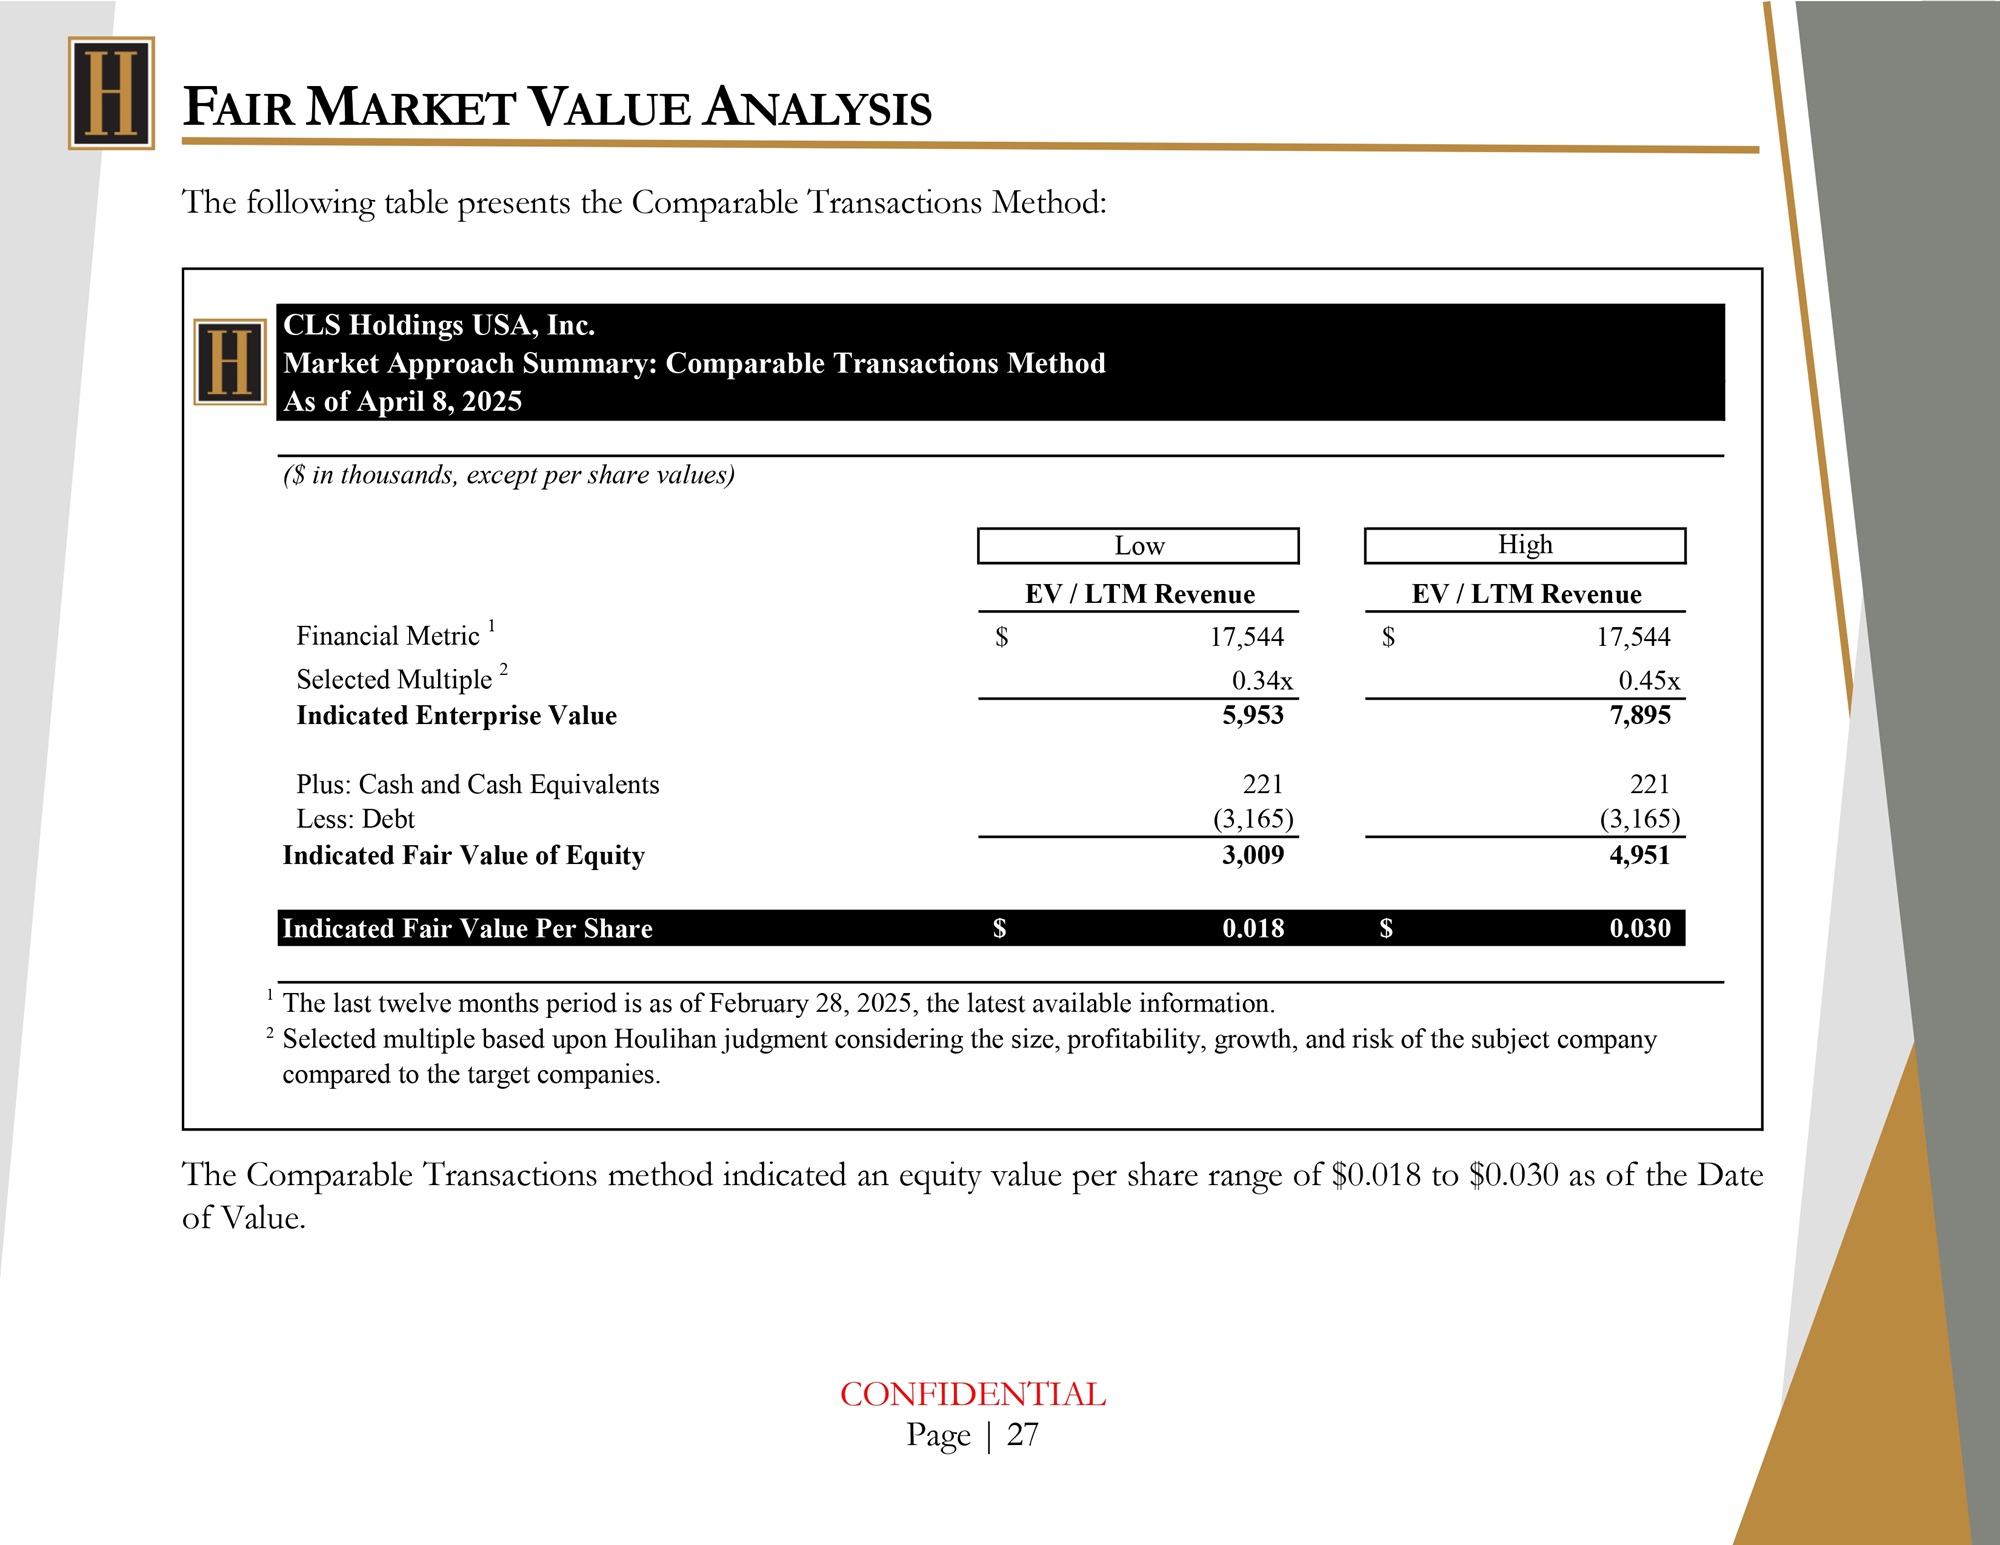
F AIR M ARKET V ALUE A NALYSIS The following table presents the Comparable Transactions Method: The Comparable Transactions method indicated an equity value per share range of $0.018 to $0.030 as of the Date of Value. CLS Holdings USA, Inc. Market Approach Summary: Comparable Transactions Method As of April 8, 2025 ($ in thousands, except per share values) Low High EV / LTM Revenue EV / LTM Revenue Financial Metric 1 $ 17,544 $ 17,544 Selected Multiple 2 0.34x 0.45x Indicated Enterprise Value 5,953 7,895 221 221 Plus: Cash and Cash Equivalents (3,165) (3,165) Less: Debt 4,951 3,009 Indicated Fair Value of Equity $ 0.030 $ 0.018 Indicated Fair Value Per Share 1 The last twelve months period is as of February 28, 2025, the latest available information. 2 Selected multiple based upon Houlihan judgment considering the size, profitability, growth, and risk of the subject company compared to the target companies. CONFIDENTIAL Page | 27
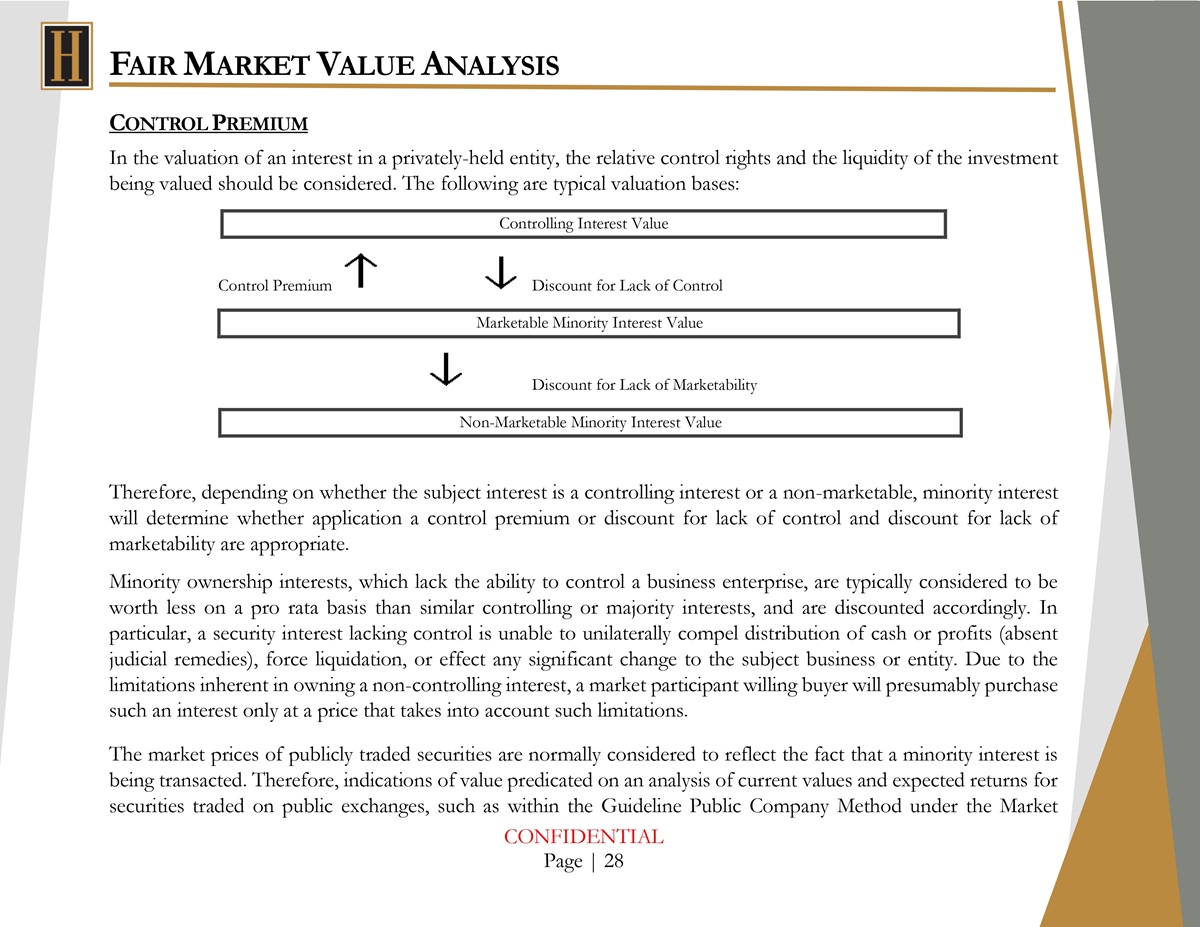
F AIR M ARKET V ALUE A NALYSIS C ONTROL P REMIUM In the valuation of an interest in a privately - held entity, the relative control rights and the liquidity of the investment being valued should be considered. The following are typical valuation bases: Controlling Interest Value Control Premium Discount for Lack of Control Marketable Minority Interest Value Discount for Lack of Marketability Non - Marketable Minority Interest Value Therefore, depending on whether the subject interest is a controlling interest or a non - marketable, minority interest will determine whether application a control premium or discount for lack of control and discount for lack of marketability are appropriate . Minority ownership interests, which lack the ability to control a business enterprise, are typically considered to be worth less on a pro rata basis than similar controlling or majority interests, and are discounted accordingly . In particular, a security interest lacking control is unable to unilaterally compel distribution of cash or profits (absent judicial remedies), force liquidation, or effect any significant change to the subject business or entity . Due to the limitations inherent in owning a non - controlling interest, a market participant willing buyer will presumably purchase such an interest only at a price that takes into account such limitations . The market prices of publicly traded securities are normally considered to reflect the fact that a minority interest is being transacted . Therefore, indications of value predicated on an analysis of current values and expected returns for securities traded on public exchanges, such as within the Guideline Public Company Method under the Market CONFIDENTIAL Page | 28
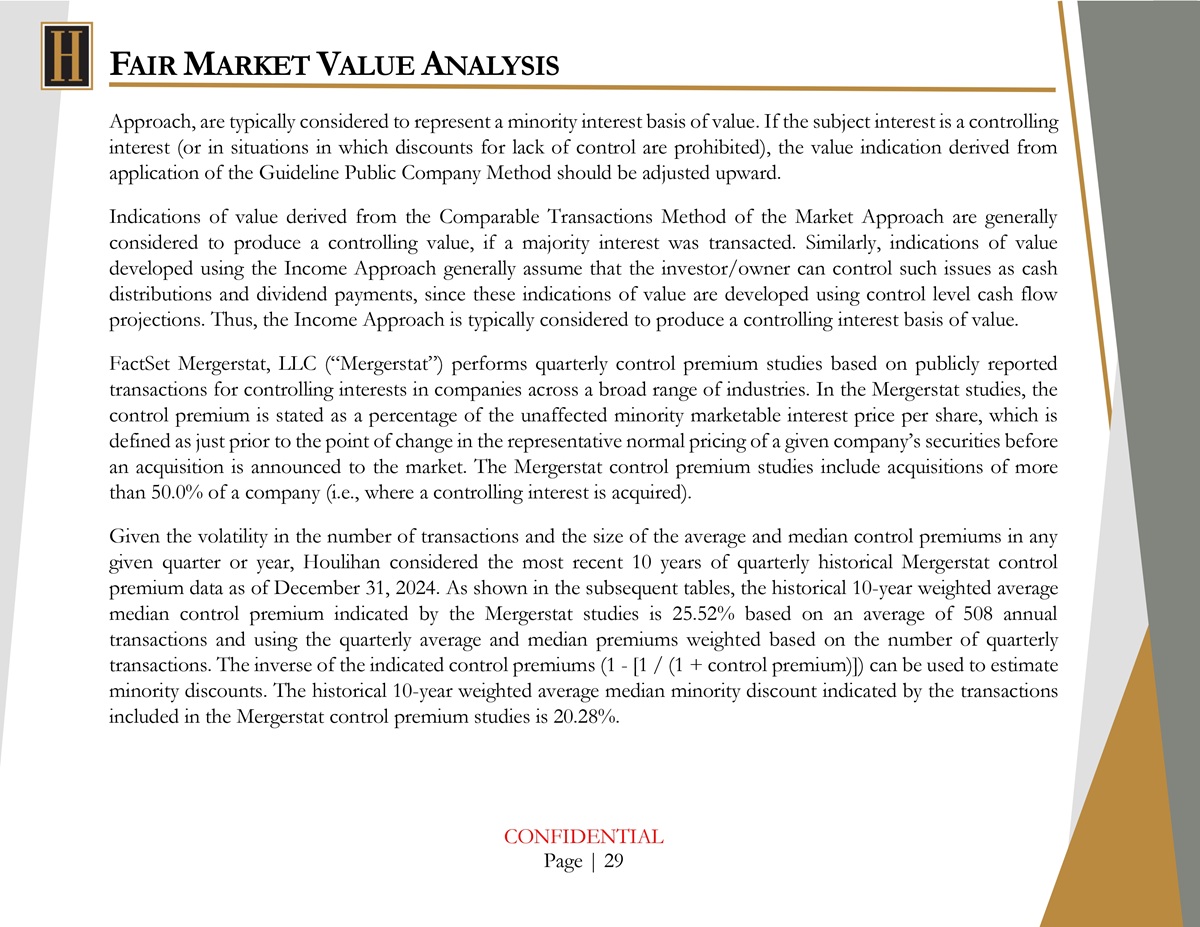
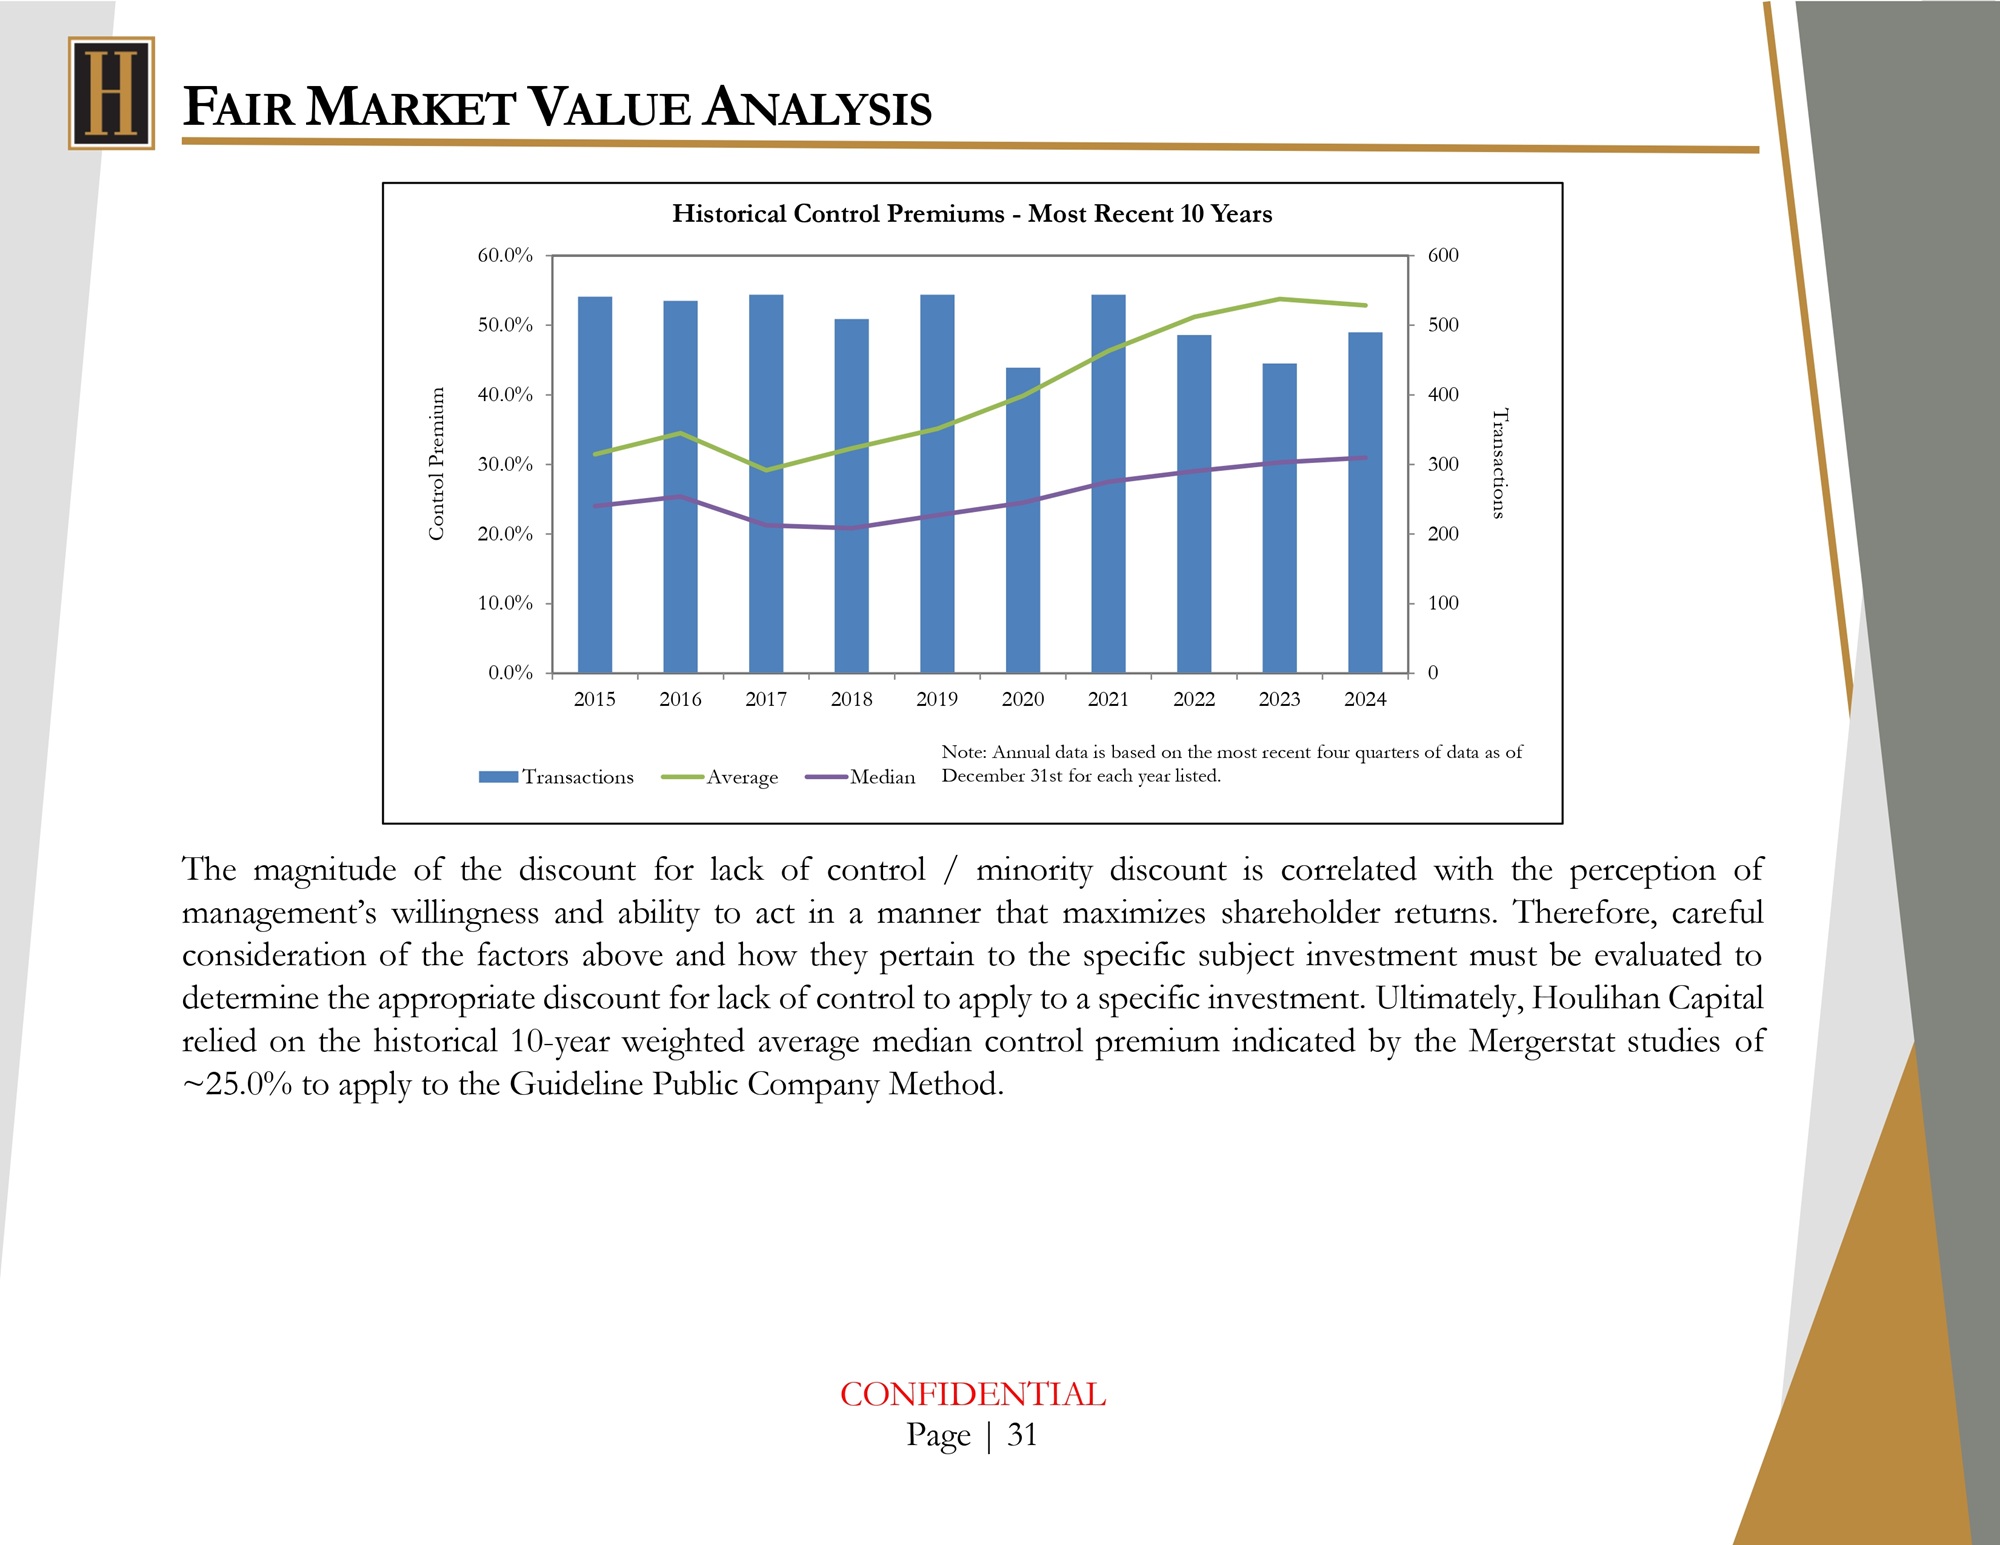
F AIR M ARKET V ALUE A NALYSIS Approach, are typically considered to represent a minority interest basis of value . If the subject interest is a controlling interest (or in situations in which discounts for lack of control are prohibited), the value indication derived from application of the Guideline Public Company Method should be adjusted upward . Indications of value derived from the Comparable Transactions Method of the Market Approach are generally considered to produce a controlling value, if a majority interest was transacted . Similarly, indications of value developed using the Income Approach generally assume that the investor/owner can control such issues as cash distributions and dividend payments, since these indications of value are developed using control level cash flow projections . Thus, the Income Approach is typically considered to produce a controlling interest basis of value . FactSet Mergerstat, LLC (“Mergerstat”) performs quarterly control premium studies based on publicly reported transactions for controlling interests in companies across a broad range of industries . In the Mergerstat studies, the control premium is stated as a percentage of the unaffected minority marketable interest price per share, which is defined as just prior to the point of change in the representative normal pricing of a given company’s securities before an acquisition is announced to the market . The Mergerstat control premium studies include acquisitions of more than 50 . 0 % of a company (i . e . , where a controlling interest is acquired) . Given the volatility in the number of transactions and the size of the average and median control premiums in any given quarter or year, Houlihan considered the most recent 10 years of quarterly historical Mergerstat control premium data as of December 31 , 2024 . As shown in the subsequent tables, the historical 10 - year weighted average median control premium indicated by the Mergerstat studies is 25 . 52 % based on an average of 508 annual transactions and using the quarterly average and median premiums weighted based on the number of quarterly transactions . The inverse of the indicated control premiums ( 1 - [ 1 / ( 1 + control premium)]) can be used to estimate minority discounts . The historical 10 - year weighted average median minority discount indicated by the transactions included in the Mergerstat control premium studies is 20 . 28 % . CONFIDENTIAL Page | 29
F AIR M ARKET V ALUE A NALYSIS Historical Control Premiums - Most Recent 10 Years 1 Control Premium (LTM Data) 2 Implied Minority Discount 3 Median Average Median 5 Average 5 Transactions Year 4 19.4% 23.9% 24.0% 31.5% 541 2015 20.3% 25.6% 25.4% 34.5% 535 2016 17.5% 22.6% 21.2% 29.2% 544 2017 17.2% 24.4% 20.8% 32.3% 509 2018 18.5% 26.0% 22.7% 35.1% 544 2019 19.7% 28.5% 24.5% 39.9% 439 2020 21.6% 31.7% 27.5% 46.3% 544 2021 22.5% 33.9% 29.0% 51.2% 486 2022 23.3% 35.0% 30.3% 53.8% 445 2023 23.6% 34.6% 31.0% 52.8% 490 2024 20.35% 28.61% 25.65% 40.66% 508 Average 19.97% 27.25% 24.95% 37.49% 522 Median 20.28% 28.41% 25.52% 40.24% 10 - Year Weighted Average 1 Data Source: Mergerstat Quarterly Control Premium Studies (Q4 2014 through Q4 2024). 2 Includes negative premium data reported by the Mergerstat studies. 3 Calculated as the inverse of the control premium: 1 - [ 1 / ( 1 + control premium ) ] 4 Annual data based on the most recent four quarters of data as of September 30th for each year listed (e.g., 2024 represents Q1 of 2024 through Q4 of 2024). 5 Weighted based on number of transactions per quarter. CONFIDENTIAL Page | 30
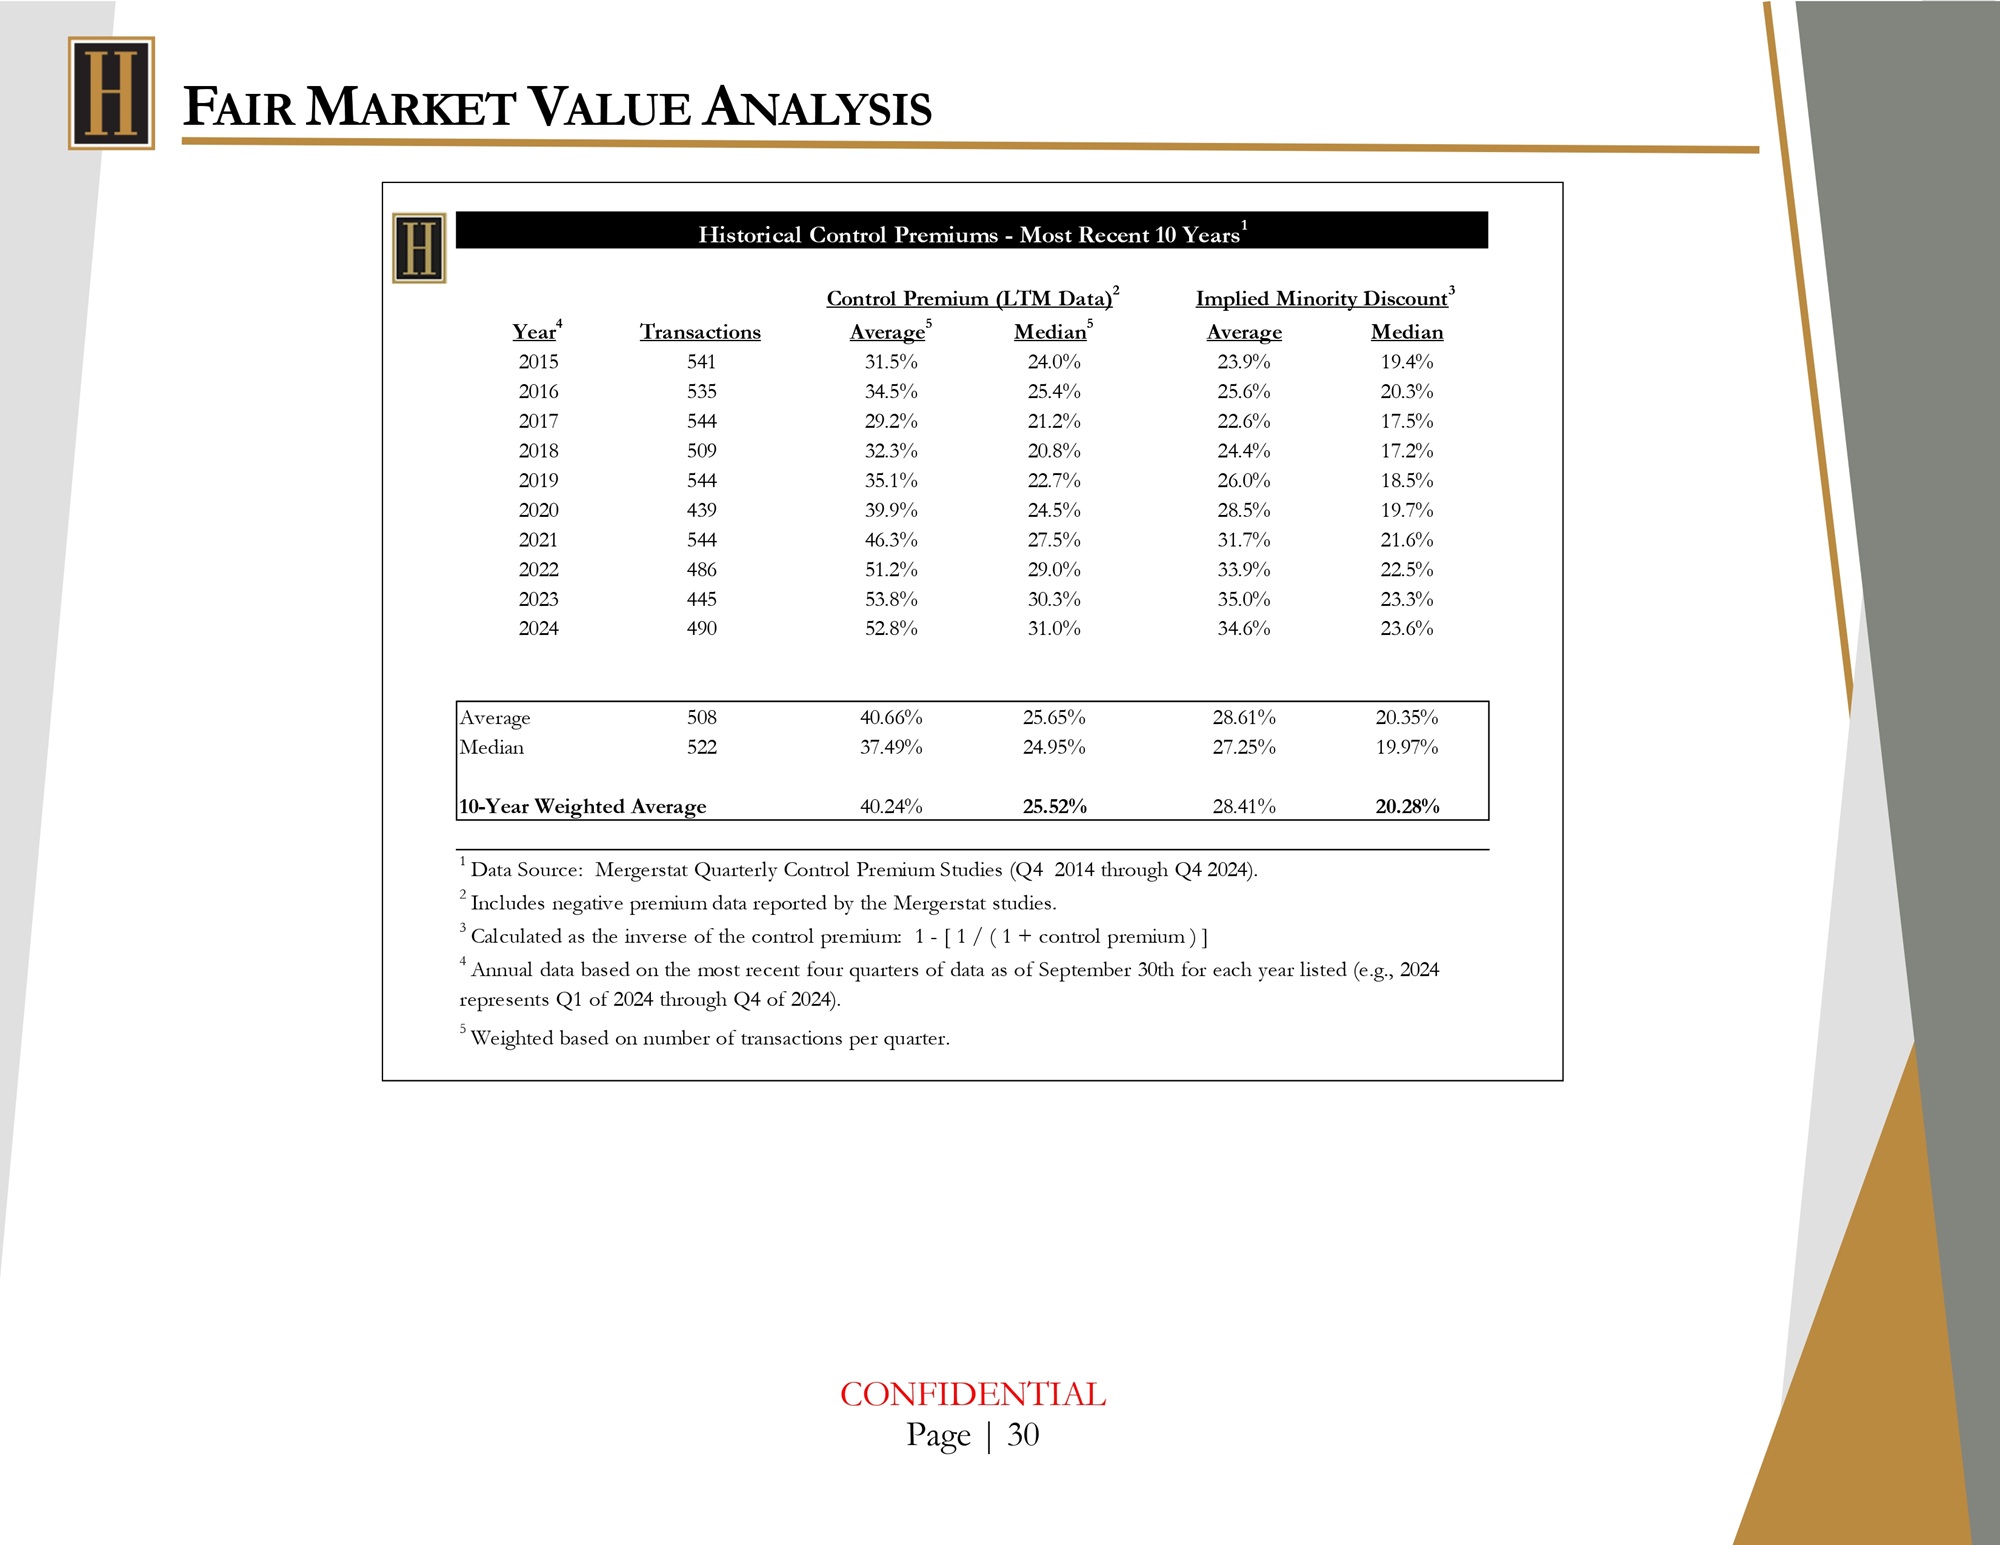
F AIR M ARKET V ALUE A NALYSIS The magnitude of the discount for lack of control / minority discount is correlated with the perception of management’s willingness and ability to act in a manner that maximizes shareholder returns . Therefore, careful consideration of the factors above and how they pertain to the specific subject investment must be evaluated to determine the appropriate discount for lack of control to apply to a specific investment . Ultimately, Houlihan Capital relied on the historical 10 - year weighted average median control premium indicated by the Mergerstat studies of ~ 25 . 0 % to apply to the Guideline Public Company Method . Historical Control Premiums - Most Recent 10 Years 60.0% 600 50.0% 500 40.0% 400 30.0% 300 20.0% 200 10.0% 100 0.0% 0 2015 2016 2017 2018 2019 2020 2021 2022 2023 2024 Transactions Average Note: Annual data is based on the most recent four quarters of data as of Median December 31st for each year listed. CONFIDENTIAL Page | 31 Control Premium Transactions
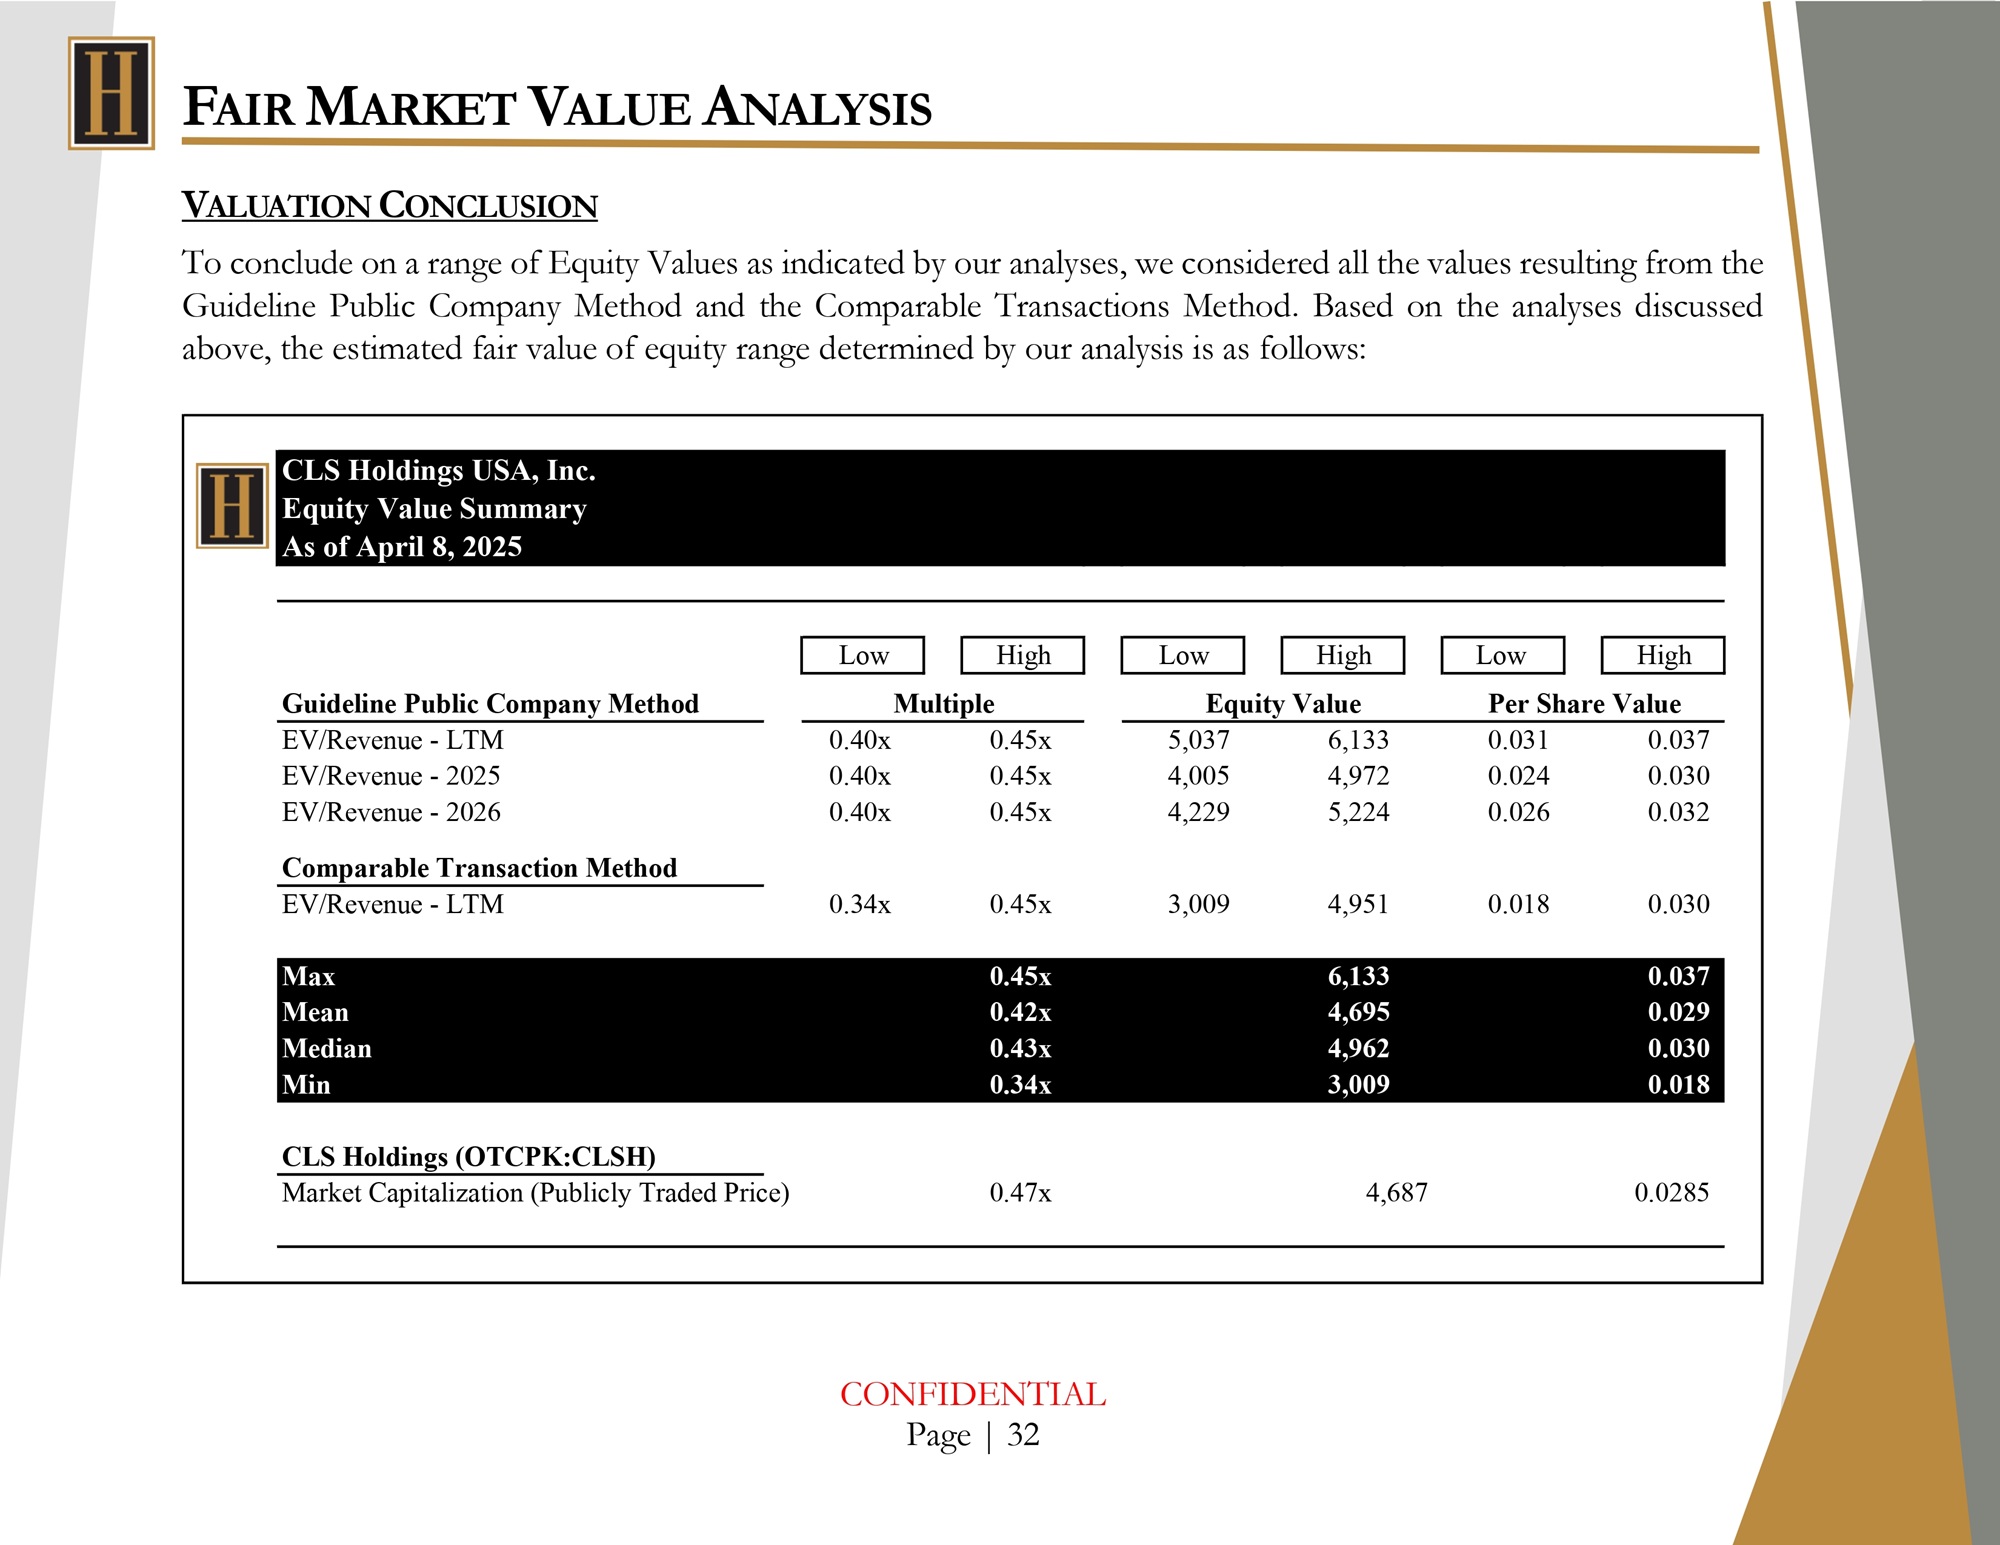
F AIR M ARKET V ALUE A NALYSIS V ALUATION C ONCLUSION To conclude on a range of Equity Values as indicated by ou r analyses, we considered all the values resulting from the Guideline Public Company Method and the Comparable Transactions Method . Based on the analyses discussed above, the estimated fair value of equity range determined by ou r analysis is as follows : CLS Holdings USA, Inc. Equity Value Summary As of April 8, 2025 Low High Low High Low High Guideline Public Company Method Multiple Equity Value Per Share Value 0.037 0.031 6,133 5,037 0.45x 0.40x EV/Revenue - LTM 0.030 0.024 4,972 4,005 0.45x 0.40x EV/Revenue - 2025 0.032 0.026 5,224 4,229 0.45x 0.40x EV/Revenue - 2026 Comparable Transaction Method 0.030 0.018 4,951 3,009 0.45x 0.34x EV/Revenue - LTM 0.037 6,133 0.45x Max 0.029 4,695 0.42x Mean 0.030 4,962 0.43x Median 0.018 3,009 0.34x Min CLS Holdings (OTCPK:CLSH) 0.0285 4,687 0.47x Market Capitalization (Publicly Traded Price) CONFIDENTIAL Page | 32
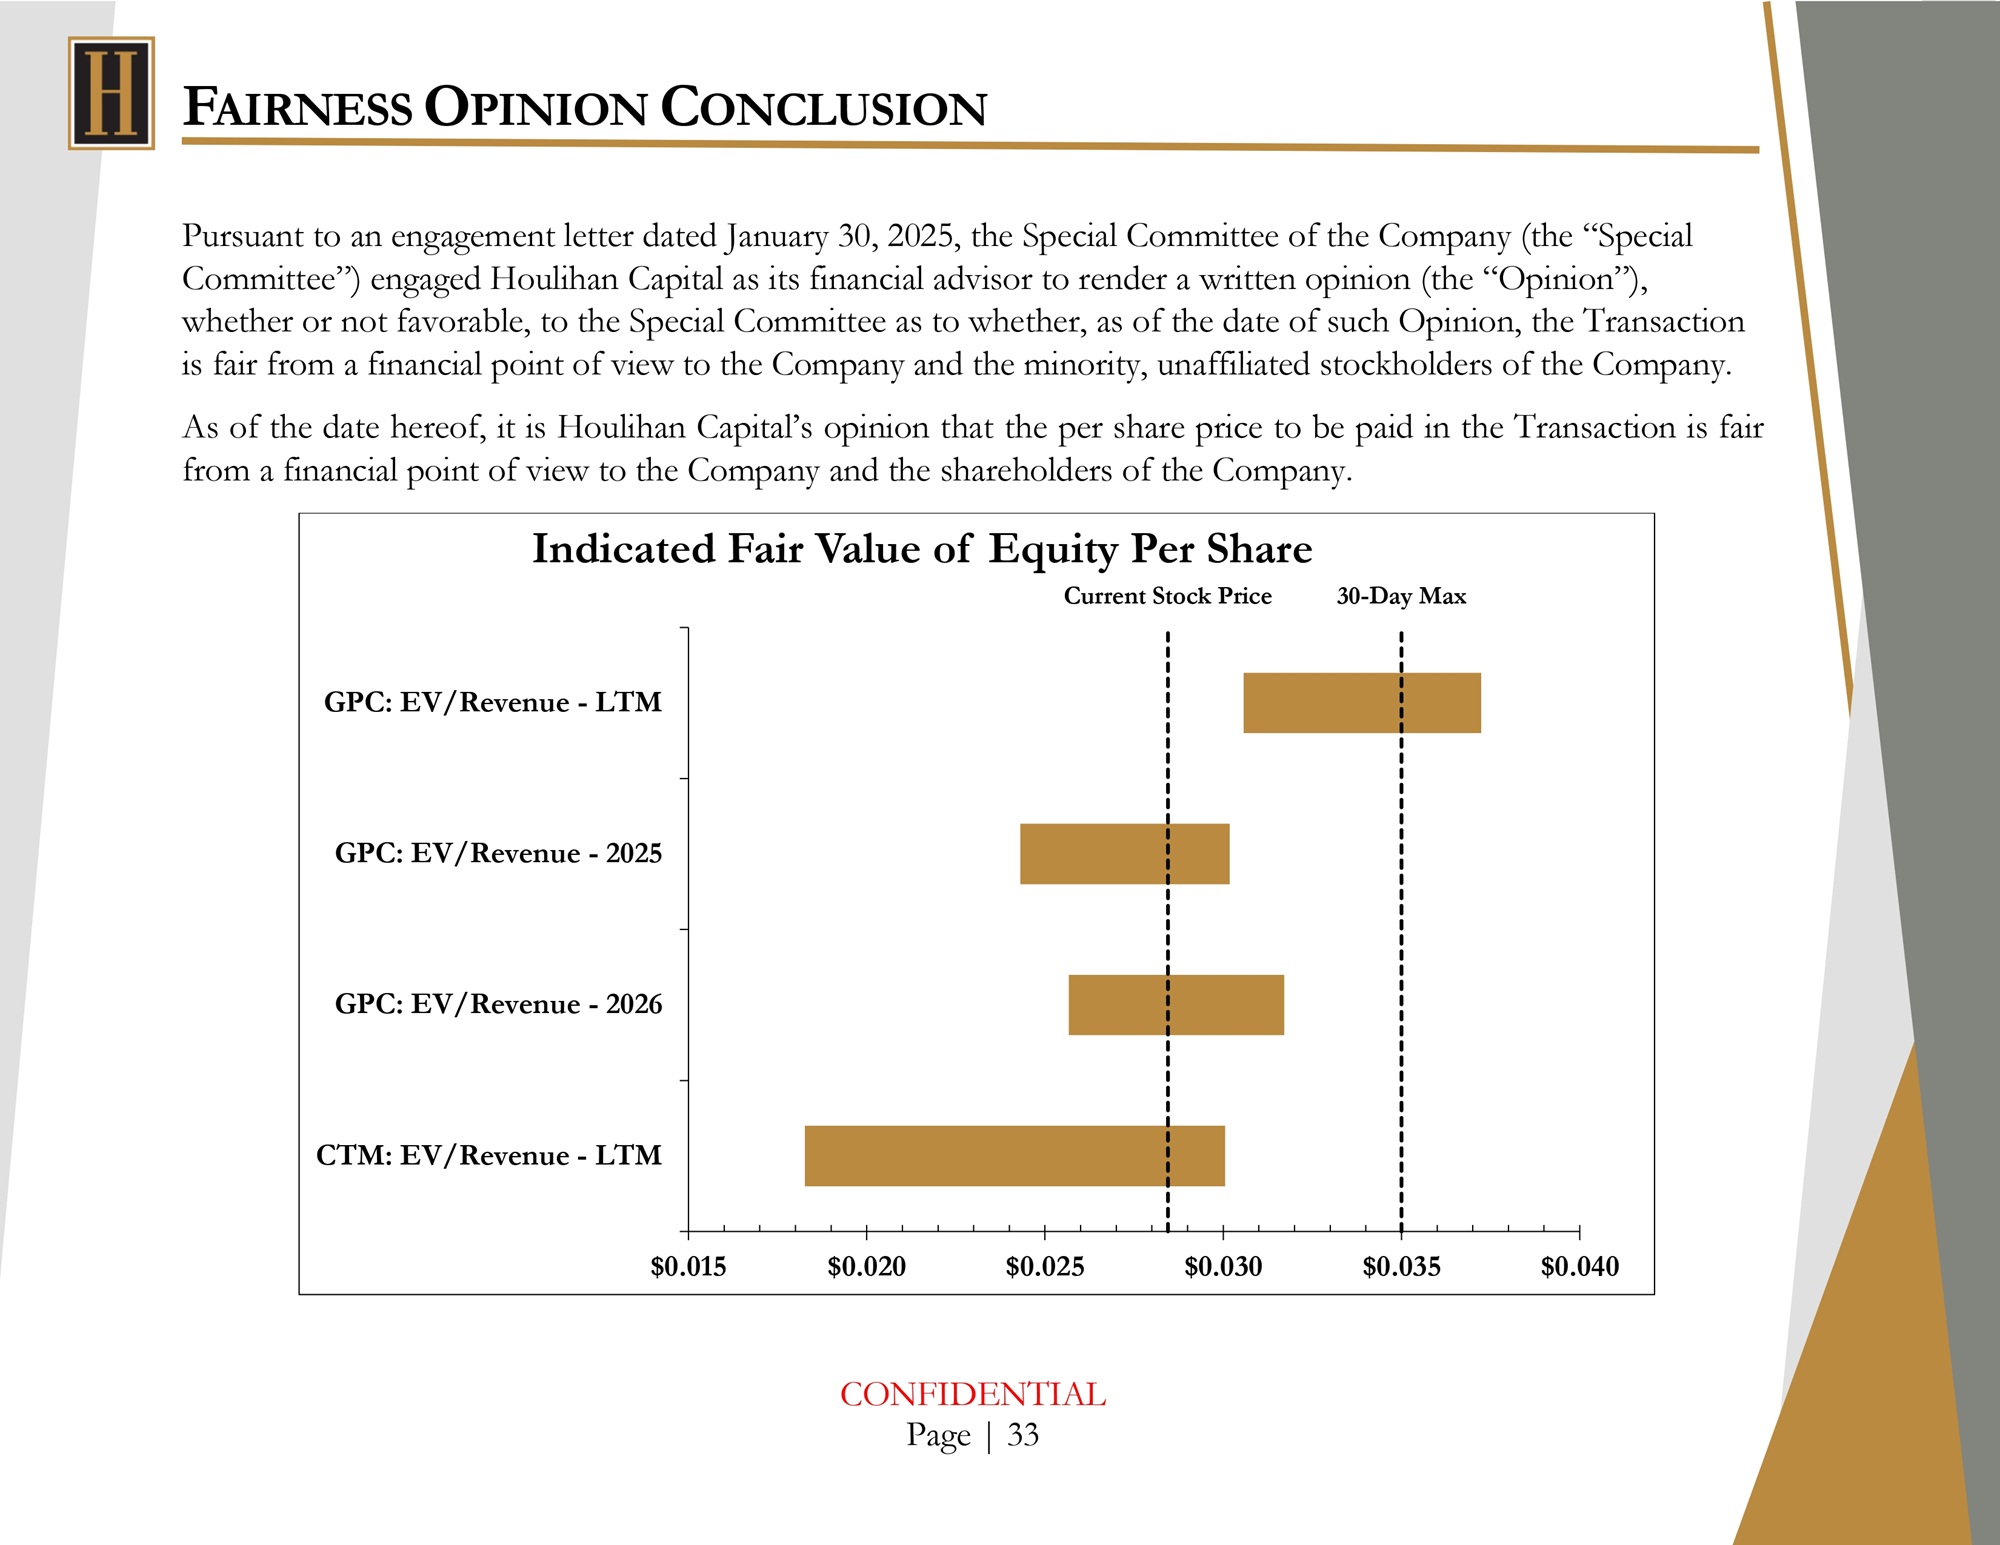
F AIRNESS O PINION C ONCLUSION $0.015 $0.020 $0.025 $0.030 $0.035 $0.040 GPC: EV/Revenue - 2025 GPC: EV/Revenue - 2026 CTM: EV/Revenue - LTM Pursuant to an engagement letter dated January 30, 2025, the Special Committee of the Company (the “Special Committee”) engaged Houlihan Capital as its financial advisor to render a written opinion (the “Opinion”), whether or not favorable, to the Special Committee as to whether, as of the date of such Opinion, the Transaction is fair from a financial point of view to the Company and the minority, unaffiliated stockholders of the Company. As of the date hereof, it is Houlihan Capital’s opinion that the per share price to be paid in the Transaction is fair from a financial point of view to the Company and the shareholders of the Company. Indicated Fair Value of Equity Per Share Current Stock Price 30 - Day Max GPC: EV/Revenue - LTM CONFIDENTIAL Page | 33
E XHIBITS G UIDELINE P UBLIC C OMPANY D ESCRIPTIONS OTCPK: CLSH CLS Holdings USA, Inc . , a diversified cannabis company, focuses on the extraction and conversion of cannabinoids in the United States . It extracts cannabinoids from the cannabis plants and converts into concentrates, that includes oils, waxes, edibles, and shatters ; and provides toll processing services . The company also sells organic medical cannabis to licensed retailers ; recreational marijuana cannabis products to licensed distributors and retailers ; extraction products, such as oils and waxes derived from in - house cannabis production ; and offers processing and extraction services for licensed medical cannabis cultivators, as well as cannabis strains in the form of vegetative cuttings to licensed medical cannabis cultivators . It offers its products under Oasis Cannabis and City Trees brand names . The company’s concentrates are used for pharmaceutical and other purposes . CLS Holdings USA, Inc . was founded in 2014 and is based in Las Vegas, Nevada . CNSX: CL Cresco Labs Inc . cultivates, manufactures, and sells retail and medical cannabis products in the United States . It provides cannabis in flowers, vape pens, live resins, disposable pens, and extracts under the Cresco brand ; vape carts, vape pens, flower, popcorn, shake, pre - rolls, shorties, and concentrates under the High Supply brand ; vapes and gummies under the Good News brand ; vapes and edibles under the Wonder Wellness Co . brand ; and tinctures, capsules, salves, and sublingual oils under the Remedi brand . The company offers cannabis flowers under the FloraCal brand ; and cannabis oils and variety of bites are available at multiple potency levels under the Mindy’s Edibles brand, as well as licenses the Kiva brand . In addition, the company offers cannabis - infused edibles under the Sunnyside brand . The company is headquartered in Chicago, Illinois . TSX: CURA Curaleaf Holdings, Inc . produces and distributes cannabis products in the United States and internationally . The company offers flower, pre - rolls, flower pots, and dry - herb vaporizer cartridges ; concentrates for vaporizing which includes pre - filled vaporizer cartridges and disposable vaporizer pens ; and concentrates for dabbing, such as distillate CONFIDENTIAL Page | 34
E XHIBITS droppers, mints, topical balms and lotions, tinctures, lozenges, capsules, and edibles . It also provides hemp - based products and cannabinoids, such as cannabidiol and cannabigerol . In addition, the company engages in the cultivation, production, and sale of hemp - derived THC products through wholesale channels . The company is headquartered in Stamford, Connecticut . CNSX: GTII Green Thumb Industries Inc . manufactures, distributes, markets, and sells of cannabis products for medical and adult - use in the United States . It operates through two segments, Retail and Consumer Packaged Goods . The company offers cannabis flower ; processed and packaged products, including pre - rolls, concentrates, vapes, tinctures, edibles, topicals, capsules, tinctures, and other cannabis - related products under the &Shine, Beboe, Dogwalkers, Doctor Solomon’s, Good Green, incredibles, and RHYTHM brands . It distributes its products to third - party licensed retail customers ; and sells finished products directly to consumers through its retail stores, as well as direct - to - consumer delivery channel . Green Thumb Industries Inc . was founded in 2014 and is headquartered in Chicago, Illinois . CNSX: PLTH Planet 13 Holdings Inc . , together with its subsidiaries, cultivates and provides cannabis and cannabis - infused products for medical and retail cannabis markets in the United States . It owns, manufactures, and sells cannabis products in the form of gummies and beverages, chocolates, vapes and concentrates, and flowers under the TRENDI, Leaf and Vine, Dreamland, HaHa, and Medizin brand names . The company also owns and operates lounge and cannabis dispensaries ; and non - cannabis retail merchandise store and event space, as well as Trece Eatery + Spirits, a coffee shop and pizzeria restaurant . In addition, it provides consultation, education, and convenience services . The company is headquartered in Las Vegas, Nevada . TSX: TSND TerrAscend Corp . cultivates, produces, and sells cannabis products in Canada and the United States . The company manufactures vaporizables, concentrates, topicals, flowers, tinctures, and edibles . It offers its products under the CONFIDENTIAL Page | 35
E XHIBITS brand name Kind Tree Cannabis, GAGE Cannabis, Legend, Valhalla Confections, State Flower Cannabis, Ilera Healthcare, Wana, Cookies, and Lemonnade . The company also operates retail dispensaries under the Apothecarium, TerrAscend, Pinnacle Emporium, GAGE Cannabis, and State Flower brand names . It serves medical patients and adult - use consumers in North America . The company was incorporated in 2017 and is headquartered in King Of Prussia, Pennsylvania . CNSX: TRUL Trulieve Cannabis Corp . operates as a cannabis retailer . The company cultivates, processes, and manufactures cannabis products and distributes its products to its dispensaries, as well as through home delivery . It sells flowers, edibles, concentrates, and accessories under the Avenue, Cultivar Collection, Muse, Modern Flower, Alchemy, Momenta, Sweet Talk, Co 2 lors, Loveli, Trekkers, and Roll One brands . The company operates dispensaries in Florida, Arizona, Georgia, Ohio, Maryland, West Virginia, Connecticut, and Pennsylvania . It operates cultivation and processing facilities in Arizona, Colorado, Florida, Georgia, Maryland, Pennsylvania, and West Virginia . The company also offers medical cannabis dispensary in North Miami Beach, Florida . Trulieve Cannabis Corp . was formerly known as Schyan Exploration Inc . /Exploration Schyan Inc . and changed its name to Trulieve Cannabis Corp . in September 2018 . Trulieve Cannabis Corp . was incorporated in 1940 and is headquartered in Quincy, Florida . NEOE: VRNO Verano Holdings Corp . operates as a vertically integrated multi - state cannabis operator in the United States . The company engages in the cultivation, processing, wholesale, and retail distribution of cannabis in Arizona, Connecticut, Florida, Illinois, Maryland, Massachusetts, Michigan, Nevada, New Jersey, Ohio, Virginia and West Virginia, and Pennsylvania . It offers cannabis products under the Encore, Avexia, MUV, Savvy, BITS, Verano, and Essence brands for medical and adult - use markets . The company is headquartered in Chicago, Illinois . CNSX: VEXT Vext Science, Inc . , through its subsidiaries, operates as an integrated agricultural technology, services, and property management company in the cannabis industry in the United States . It owns and manages cultivation facilities, CONFIDENTIAL Page | 36

E XHIBITS manufacturing units, and dispensaries ; and involves in the cultivation, extraction, manufacture, and sale of THC and CBD cartridges, concentrates, and edibles . The company also engages in the retail dispensary activities ; and wholesale distribution of cannabis THC and hemp CBD products under the Vapen, Pure Touch, Appalachian Pharm, Herbal Wellness, and Revibe brands . In addition, it provides management, advisory, cultivation, non - cannabis products, and dispensary services to entities in the cannabis field through operations agreements and direct sales . The company was formerly known as Vapen MJ Ventures Corporation and changed its name to Vext Science, Inc . in November 2019 . Vext Science, Inc . was incorporated in 2015 and is headquartered in Phoenix, Arizona . CONFIDENTIAL Page | 37
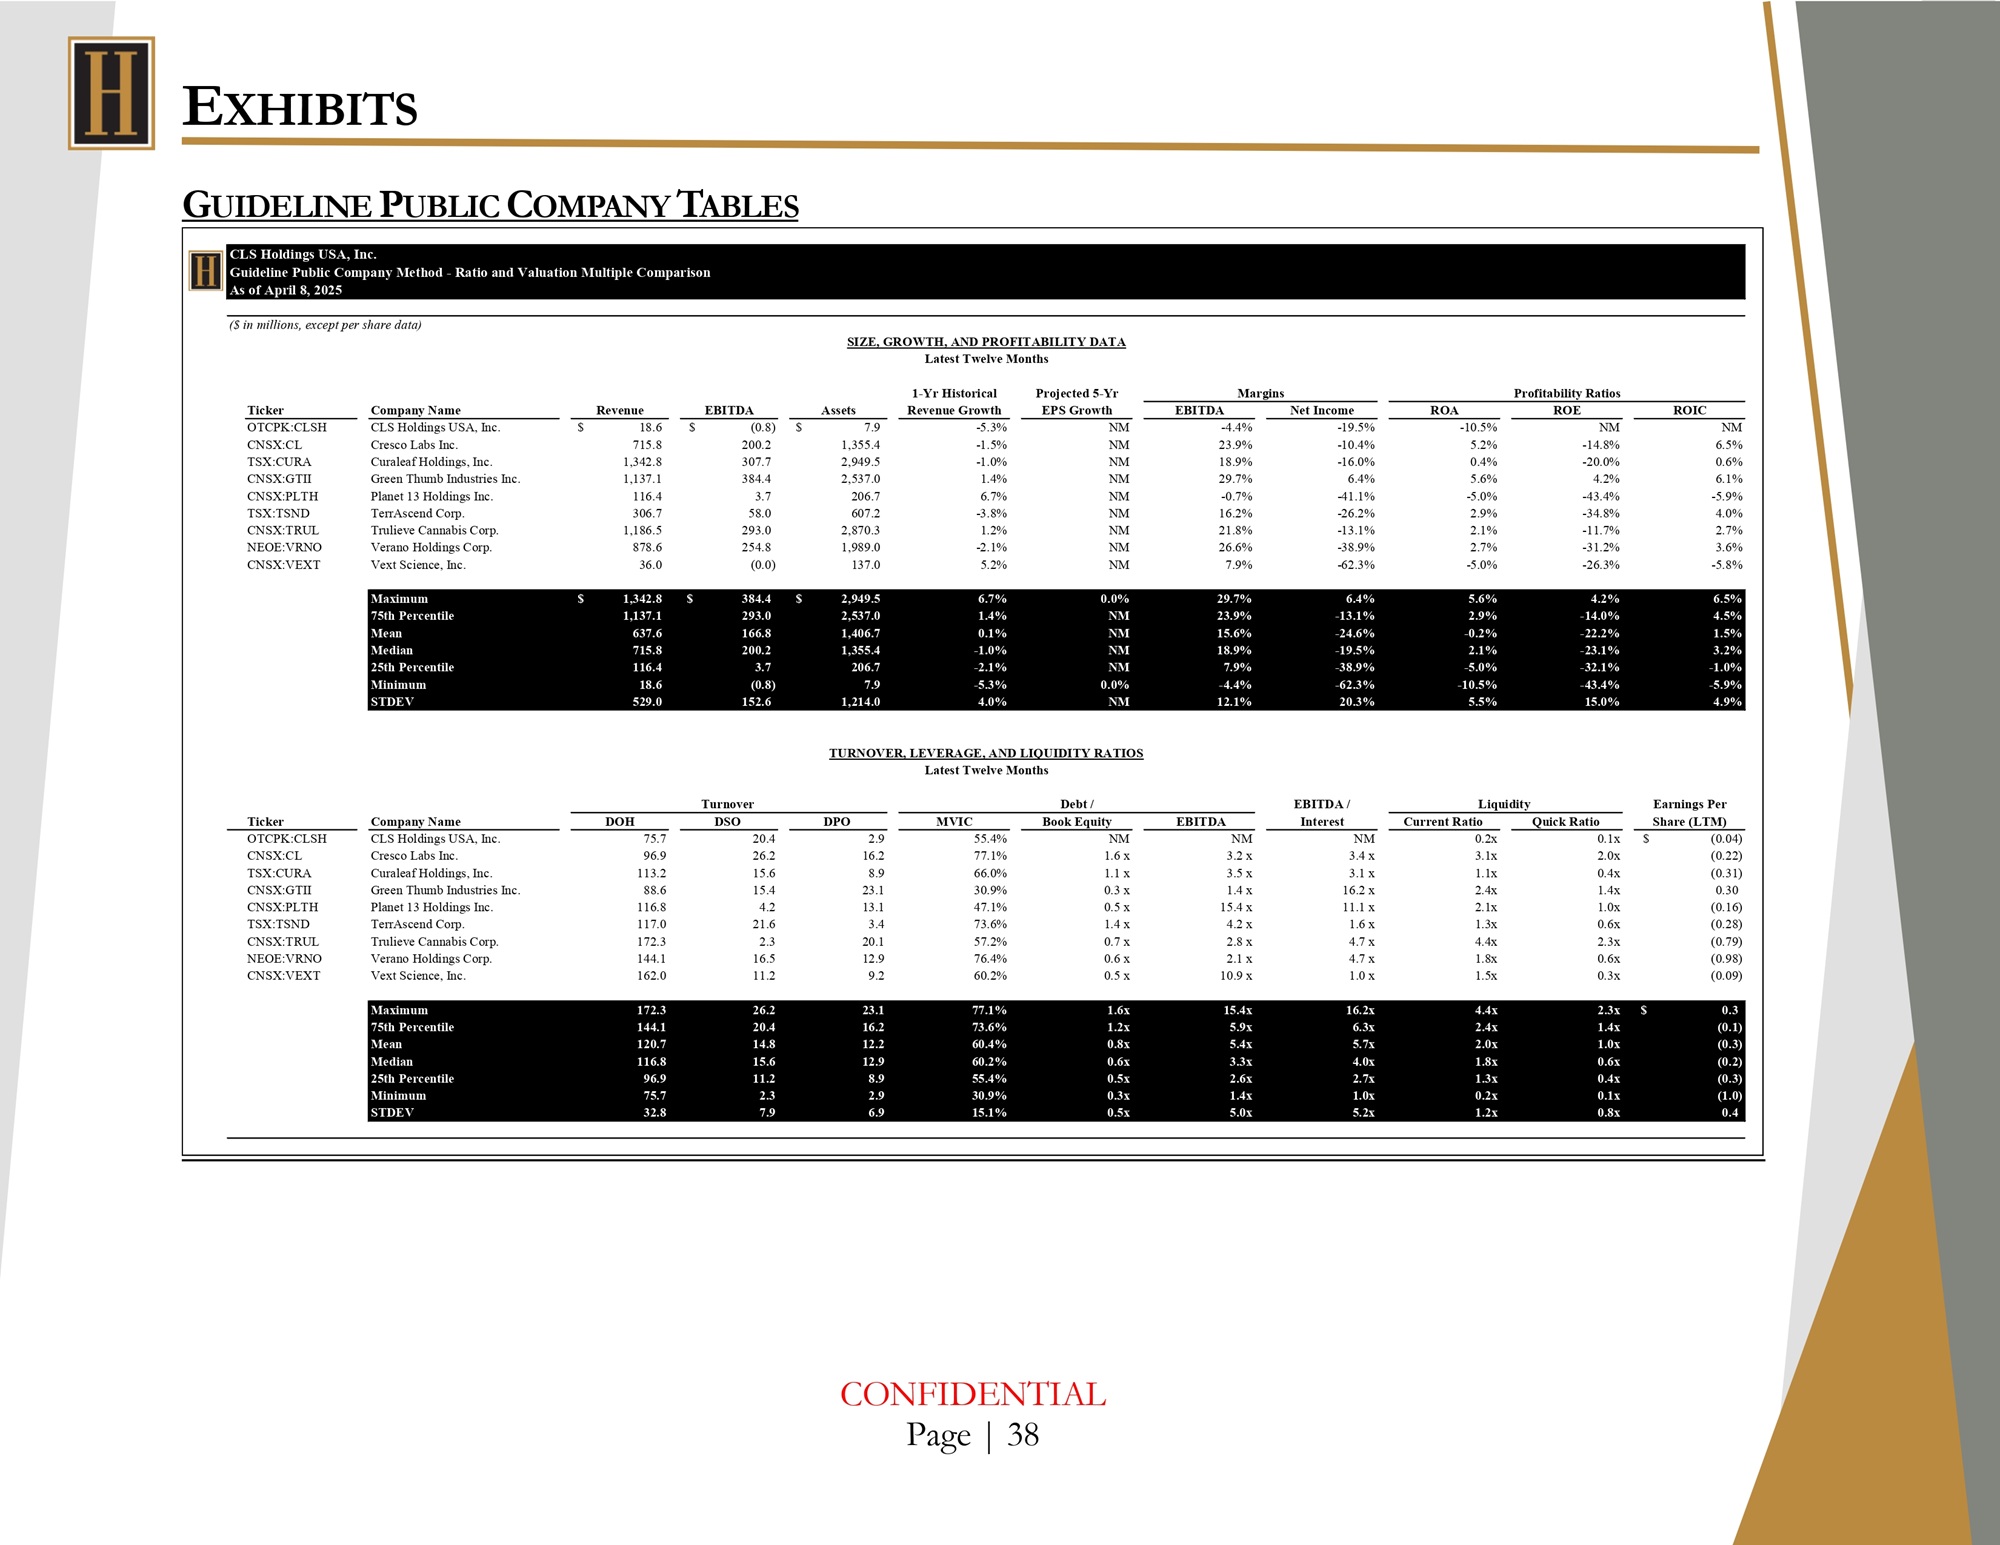
E XHIBITS G UIDELINE P UBLIC C OMPANY T ABLES CLS Holdings USA, Inc. Guideline Public Company Method - Ratio and Valuation Multiple Comparison As of April 8, 2025 ($ in millions, except per share data) SIZE, GROWTH, AND PROFITABILITY DATA Latest Twelve Months Margins Profitability Ratios Ticker Company Name Revenue EBITDA Assets 1 - Yr Historical Revenue Growth Projected 5 - Yr EPS Growth EBITDA Net Income ROA ROE ROIC $ $ OTCPK:CLSH CNSX:CL TSX:CURA CNSX:GTII CNSX:PLTH TSX:TSND CNSX:TRUL NEOE:VRNO CNSX:VEXT CLS Holdings USA, Inc. Cresco Labs Inc. Curaleaf Holdings, Inc. Green Thumb Industries Inc. Planet 13 Holdings Inc. TerrAscend Corp. Trulieve Cannabis Corp. Verano Holdings Corp. Vext Science, Inc. 18.6 715.8 1,342.8 1,137.1 116.4 306.7 1,186.5 878.6 36.0 (0.8) $ 200.2 307.7 384.4 3.7 58.0 293.0 254.8 (0.0) 7.9 1,355.4 2,949.5 2,537.0 206.7 607.2 2,870.3 1,989.0 137.0 - 5.3% - 1.5% - 1.0% 1.4% 6.7% - 3.8% 1.2% - 2.1% 5.2% NM NM NM NM NM NM NM NM NM - 4.4% 23.9% 18.9% 29.7% - 0.7% 16.2% 21.8% 26.6% 7.9% - 19.5% - 10.4% - 16.0% 6.4% - 41.1% - 26.2% - 13.1% - 38.9% - 62.3% - 10.5% 5.2% 0.4% 5.6% - 5.0% 2.9% 2.1% 2.7% - 5.0% NM - 14.8% - 20.0% 4.2% - 43.4% - 34.8% - 11.7% - 31.2% - 26.3% NM 6.5% 0.6% 6.1% - 5.9% 4.0% 2.7% 3.6% - 5.8% $ Maximum 75th Percentile Mean Median 25th Percentile Minimum STDEV 1,342.8 $ 1,137.1 637.6 715.8 116.4 18.6 529.0 384.4 $ 293.0 166.8 200.2 3.7 (0.8) 152.6 2,949.5 2,537.0 1,406.7 1,355.4 206.7 7.9 1,214.0 6.7% 1.4% 0.1% - 1.0% - 2.1% - 5.3% 4.0% 0 . 0 % NM NM NM NM 0 . 0 % NM 29.7% 23.9% 15.6% 18.9% 7.9% - 4.4% 12.1% 6.4% - 13.1% - 24.6% - 19.5% - 38.9% - 62.3% 20.3% 5.6% 2.9% - 0.2% 2.1% - 5.0% - 10.5% 5.5% 4.2% - 14.0% - 22.2% - 23.1% - 32.1% - 43.4% 15.0% 6.5% 4.5% 1.5% 3.2% - 1.0% - 5.9% 4.9% TURNOVER, LEVERAGE, AND LIQUIDITY RATIOS Latest Twelve Months Turnover Debt / Liquidity Ticker Company Name DOH DSO DPO MVIC Book Equity EBITDA EBITDA / Interest Current Ratio Quick Ratio Earnings Per Share (LTM) OTCPK:CLSH CNSX:CL TSX:CURA CNSX:GTII CNSX:PLTH TSX:TSND CNSX:TRUL NEOE:VRNO CNSX:VEXT CLS Holdings USA, Inc. Cresco Labs Inc. Curaleaf Holdings, Inc. Green Thumb Industries Inc. Planet 13 Holdings Inc. TerrAscend Corp. Trulieve Cannabis Corp. Verano Holdings Corp. Vext Science, Inc. 75.7 96.9 113.2 88.6 116.8 117.0 172.3 144.1 162.0 20.4 26.2 15.6 15.4 4.2 21.6 2.3 16.5 11.2 2.9 16.2 8.9 23.1 13.1 3.4 20.1 12.9 9.2 55.4% 77.1% 66.0% 30.9% 47.1% 73.6% 57.2% 76.4% 60.2% NM 1.6 x 1.1 x 0.3 x 0.5 x 1.4 x 0.7 x 0.6 x 0.5 x NM 3.2 x 3.5 x 1.4 x 15.4 x 4.2 x 2.8 x 2.1 x 10.9 x NM 3.4 x 3.1 x 16.2 x 11.1 x 1.6 x 4.7 x 4.7 x 1.0 x 0.2x 3.1x 1.1x 2.4x 2.1x 1.3x 4.4x 1.8x 1.5x 0.1x $ 2.0x 0.4x 1.4x 1.0x 0.6x 2.3x 0.6x 0.3x (0.04) (0.22) (0.31) 0.30 (0.16) (0.28) (0.79) (0.98) (0.09) Maximum 75th Percentile Mean Median 25th Percentile Minimum STDEV 172.3 144.1 120.7 116.8 96.9 75.7 32.8 26.2 20.4 14.8 15.6 11.2 2.3 7.9 23.1 16.2 12.2 12.9 8.9 2.9 6.9 77.1% 73.6% 60.4% 60.2% 55.4% 30.9% 15.1% 1.6x 1.2x 0.8x 0.6x 0.5x 0.3x 0.5x 15.4x 5.9x 5.4x 3.3x 2.6x 1.4x 5.0x 16.2x 6.3x 5.7x 4.0x 2.7x 1.0x 5.2x 4.4x 2.4x 2.0x 1.8x 1.3x 0.2x 1.2x 2.3x $ 1.4x 1.0x 0.6x 0.4x 0.1x 0.8x 0.3 (0.1) (0.3) (0.2) (0.3) (1.0) 0.4 CONFIDENTIAL Page | 38
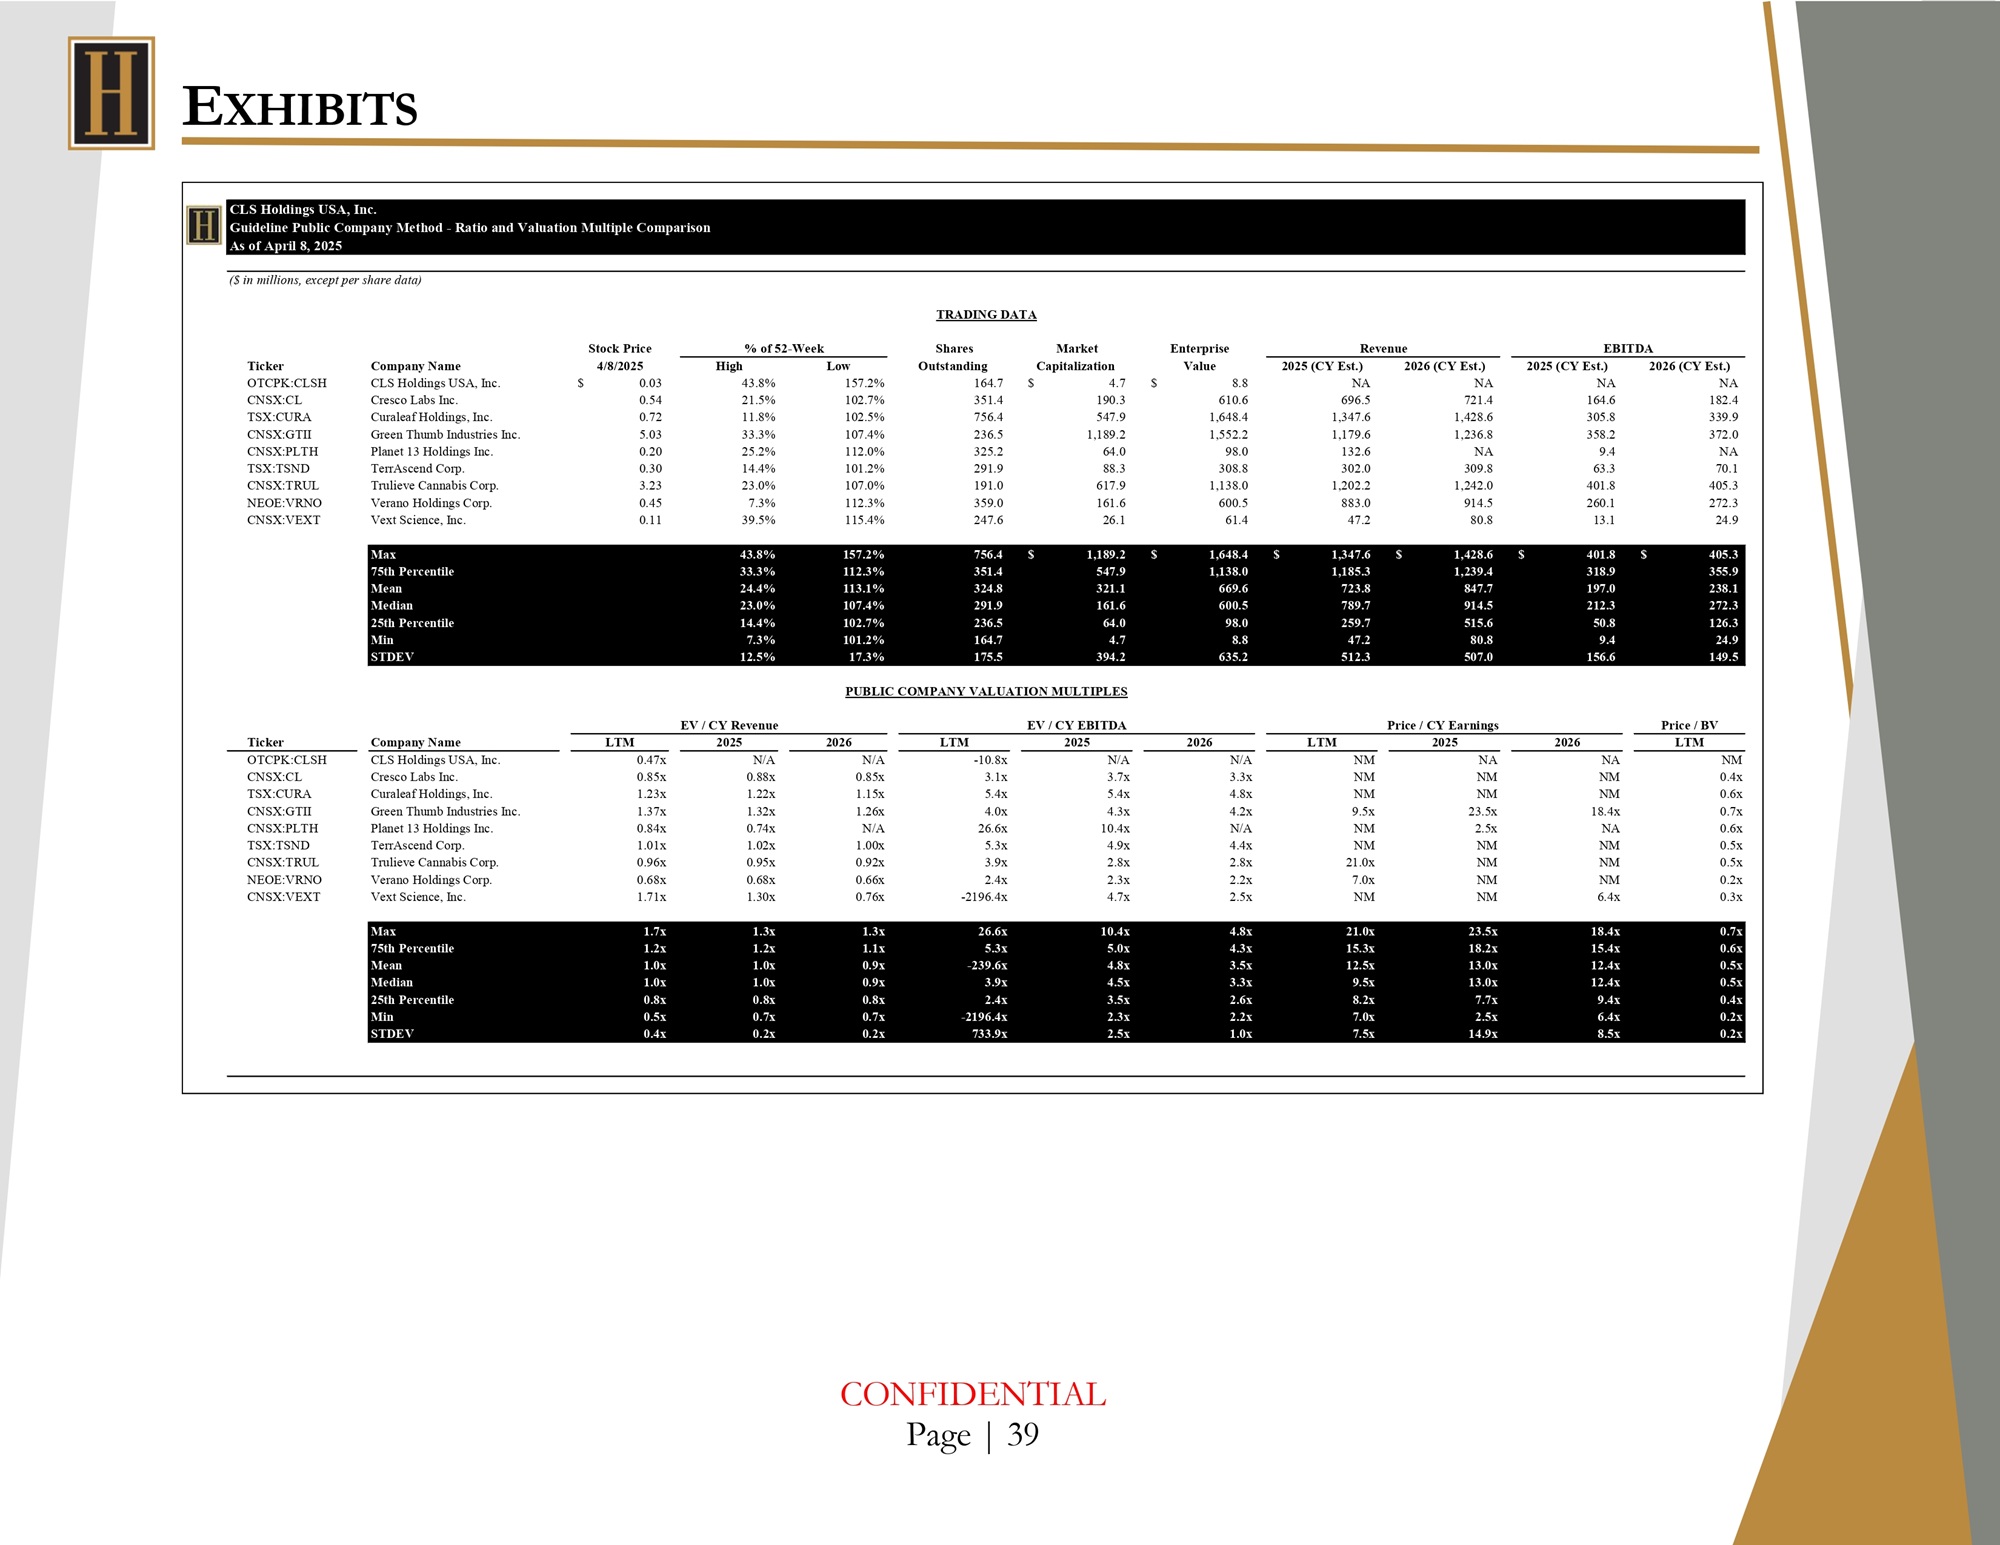
E XHIBITS CLS Holdings USA, Inc. Guideline Public Company Method - Ratio and Valuation Multiple Comparison As of April 8, 2025 ($ in millions, except per share data) TRADING DATA % of 52 - Week Revenue EBITDA Enterprise Value $ Ticker OTCPK:CLSH CNSX:CL TSX:CURA CNSX:GTII CNSX:PLTH TSX:TSND CNSX:TRUL NEOE:VRNO CNSX:VEXT Company Name CLS Holdings USA, Inc. Cresco Labs Inc. Curaleaf Holdings, Inc. Green Thumb Industries Inc. Planet 13 Holdings Inc. TerrAscend Corp. Trulieve Cannabis Corp. Verano Holdings Corp. Vext Science, Inc. Stock Price 4/8/2025 0.03 0.54 0.72 5.03 0.20 0.30 3.23 0.45 0.11 High 43.8% 21.5% 11.8% 33.3% 25.2% 14.4% 23.0% 7.3% 39.5% Low 157.2% 102.7% 102.5% 107.4% 112.0% 101.2% 107.0% 112.3% 115.4% Shares Outstanding 164.7 $ 351.4 756.4 236.5 325.2 291.9 191.0 359.0 247.6 Market Capitalization 4.7 $ 190.3 547.9 1,189.2 64.0 88.3 617.9 161.6 26.1 8.8 610.6 1,648.4 1,552.2 98.0 308.8 1,138.0 600.5 61.4 2025 (CY Est.) NA 696.5 1,347.6 1,179.6 132.6 302.0 1,202.2 883.0 47.2 2026 (CY Est.) NA 721.4 1,428.6 1,236.8 NA 309.8 1,242.0 914.5 80.8 2025 (CY Est.) NA 164.6 305.8 358.2 9.4 63.3 401.8 260.1 13.1 2026 (CY Est.) NA 182.4 339.9 372.0 NA 70.1 405.3 272.3 24.9 Max 75th Percentile Mean Median 25th Percentile Min STDEV 43.8% 33.3% 24.4% 23.0% 14.4% 7.3% 12.5% 157.2% 112.3% 113.1% 107.4% 102.7% 101.2% 17.3% 756.4 $ 351.4 324.8 291.9 236.5 164.7 175.5 1,189.2 $ 547.9 321.1 161.6 64.0 4.7 394.2 1,648.4 $ 1,138.0 669.6 600.5 98.0 8.8 635.2 1,347.6 $ 1,185.3 723.8 789.7 259.7 47.2 512.3 1,428.6 $ 1,239.4 847.7 914.5 515.6 80.8 507.0 401.8 $ 318.9 197.0 212.3 50.8 9.4 156.6 405.3 355.9 238.1 272.3 126.3 24.9 149.5 PUBLIC COMPANY VALUATION MULTIPLES EV / CY Revenue EV / CY EBITDA Price / CY Earnings Price / BV Ticker Company Name LTM 2025 2026 LTM 2025 2026 LTM 2025 2026 LTM OTCPK:CLSH CNSX:CL TSX:CURA CNSX:GTII CNSX:PLTH TSX:TSND CNSX:TRUL NEOE:VRNO CNSX:VEXT CLS Holdings USA, Inc. Cresco Labs Inc. Curaleaf Holdings, Inc. Green Thumb Industries Inc. Planet 13 Holdings Inc. TerrAscend Corp. Trulieve Cannabis Corp. Verano Holdings Corp. Vext Science, Inc. 0.47x 0.85x 1.23x 1.37x 0.84x 1.01x 0.96x 0.68x 1.71x N/A 0.88x 1.22x 1.32x 0.74x 1.02x 0.95x 0.68x 1.30x N/A 0.85x 1.15x 1.26x N/A 1.00x 0.92x 0.66x 0.76x - 10.8x 3.1x 5.4x 4.0x 26.6x 5.3x 3.9x 2.4x - 2196.4x N/A 3.7x 5.4x 4.3x 10.4x 4.9x 2.8x 2.3x 4.7x N/A 3.3x 4.8x 4.2x N/A 4.4x 2.8x 2.2x 2.5x NM NM NM 9 . 5 x NM NM 21 . 0 x 7.0x NM NA NM NM 23.5x 2 . 5 x NM NM NM NM NA NM NM 18.4x NA NM NM NM 6.4x NM 0.4x 0.6x 0.7x 0.6x 0.5x 0.5x 0.2x 0.3x Max 75th Percentile Mean Median 25th Percentile Min STDEV 1.7x 1.2x 1.0x 1.0x 0.8x 0.5x 0.4x 1.3x 1.2x 1.0x 1.0x 0.8x 0.7x 0.2x 1.3x 1.1x 0.9x 0.9x 0.8x 0.7x 0.2x 26.6x 5.3x - 239.6x 3.9x 2.4x - 2196.4x 733.9x 10.4x 5.0x 4.8x 4.5x 3.5x 2.3x 2.5x 4.8x 4.3x 3.5x 3.3x 2.6x 2.2x 1.0x 21.0x 15.3x 12.5x 9.5x 8.2x 7.0x 7.5x 23.5x 18.2x 13.0x 13.0x 7.7x 2.5x 14.9x 18.4x 15.4x 12.4x 12.4x 9.4x 6.4x 8.5x 0.7x 0.6x 0.5x 0.5x 0.4x 0.2x 0.2x CONFIDENTIAL Page | 39
E XHIBITS G UIDELINE T RANSACTION T ARGET C OMPANY D ESCRIPTIONS Acreage Holdings, Inc . Acreage Holdings, Inc . operates in cannabis industry in the United States . It cultivates and processes cannabis plants ; manufactures branded consumer products ; distributes cannabis flower and manufactured products ; and retails dosable cannabis products to consumers . The company serves medical and adult recreational use customers in Connecticut, Illinois, Maine, Massachusetts, New Jersey, New York, Ohio, and Pennsylvania under The Botanist, Prime, and Superflux brands . Acreage Holdings, Inc . was founded in 2011 and is headquartered in New York, New York . As of December 9 , 2024 , Acreage Holdings, Inc . operates as subsidiary of Canopy USA, LLC . HEXO Corp . HEXO Corp . , together with its subsidiaries, produces, markets, and sells cannabis in Canada . The company offers its adult - use and medical products under the HEXO brand name . It also provides cannabis beverages under the Little Victory, House of Terpenes, Mollo, Veryvell, and XMG brands ; and cannabis products under UP Cannabis, Original Stash, and Up brand names . It has a strategic alliance with Tilray Brands, Inc . The company was formerly known as The Hydropothecary Corporation and changed its name to HEXO Corp . in August 2018 . HEXO Corp . was founded in 2013 and is headquartered in Gatineau, Canada . As of June 22 , 2023 , HEXO Corp . operates as a subsidiary of Tilray Brands, Inc . The Valens Company Inc . The Valens Company Inc . , through its subsidiaries, develops, manufactures, and sells cannabinoid - based products in Canada, the United States, and internationally . The company provides packaged dried flower/pre - rolls under the Verse, Versus, Contraband, and Citizen Stash brands ; vapourizers and hydrocarbon extracts under the Verse and Versus brands ; edible cannabis products under the Verse, Vacay, and LYF brands ; and topical cannabis under the Nuance brand . It also offers analytical testing services to third party licensed producers in the cannabis space . The company is headquartered in Toronto, Canada . As of January 17 , 2023 , The Valens Company Inc . operates as a subsidiary of SNDL Inc . CONFIDENTIAL Page | 40
E XHIBITS VIVO Cannabis Inc . VIVO Cannabis Inc . produces and sells cannabis products for the medical and adult - use markets in Canada, Germany, and Australia . It offers dried cannabis flower products, pre - rolls, and cannabis oils ; and cannabis - derived products under the Canna Farms, Beacon Medical, Fireside, and Lumina brands, as well as provides cannabis - related medical information and services . The company also operates a network of medical cannabis clinics under the Harvest Medicine brand ; and HMED Connect telemedicine platform, an online medical cannabis store . In addition, it engages in the ethanol extraction, product formulation, and EU - GMP related processes . The company is headquartered in Napanee, Canada . As of April 1 , 2023 , VIVO Cannabis Inc . operates as a subsidiary of MediPharm Labs Corp . CONFIDENTIAL Page | 41